Overview
Video game magazines used to be the hub of video game discourse, with the latest news, editorials on the state of the industry, and reviews. While the internet eventually led to the demise of most of these magazines I still find it fascinating to look through them to see what was and wasn’t a big deal at the time.
I made this archive to make these magazines more accessible and to help fans of my favorite genre. I have collected as many JRPG reviews from magazines as I could find and presented them here. If you’re here you’d probably also be interested in my JRPG project, where I analyze JRPGs based on review scores, price, exclusivity, and more.
These scans mostly come from RetroMags, Out of Print Archive, Datassette, this archive, and the Internet Archive (including many uploaded by Foxhack). A few are from the Video Game History Foundation’s Digital Archive, including all scans of Computer Entertainer, which they own and have made available under a Creative Commons license
I update this archive periodically, see the section below. As for the games, I am mostly using JRPG Chronicle’s JRPG Index, which is maintained by Blingles/Shantotto, but I have included some additional games, like a few games developed in South Korea. It’s a great website and discord channel for JRPG lovers, check it out if you’re into JRPGs.
This archive includes video game magazines from the United States, United Kingdom, Canada, Australia, New Zealand, and South Africa. Every English language gaming magazine I could find:
Collapse/Expand
360Zine
64 Extreme
@Gamer
Advance
Arcade
Australian PlayStation
Computer & Video Games
Computer Games
Computer Game Review and 16-bit Entertainment
Computer Gaming World
Computer Entertainer
Control
Cube
Cube Australia
DC UK
Dreamcast Magazine
Dreamcast Monthly
Electric Brain
Electronic Entertainment
Electronic Game Player
Electronic Games
Electronic Gaming Monthly
Extreme PlayStation
Fusion
G-Force
GameFan
GameFan (reboot)
Gamefreaks
GBA World
GMR
Games World
Game Boy Official
Game Boy Power
Game Informer
Game On!
Game Players
Game Player’s
Game Zone
GameNow
GamePro
Gamereactor
Games-X
Gamestar
Gamers’ Republic
Games Domain Offline
Games TM
Hardcore Gamer
HGZine
Hyper
IGN64.com
Incite
Intelligent Gamer
Maximum
Mean Machines
Mean Machines PlayStation
Mean Machines Sega
Mega
Mega Drive Advanced Gaming
Mega Play
Mega Power
MegaZone
Megafan
Megatech
Mr Dreamcast
N-Force
N64
N64 Magazine
N64 Pro
NGC
NGamer (UK)
NGamer (USA)
NewType Gaming
New Age Gaming
New Zealand PlayStation
Next3
Next Generation
Nintendo Game Zone
Nintendo Gamer
Nintendo Magazine System (Australia)
Nintendo Official Magazine
Nintendo Power
Nintendo Power Flash
Official Dreamcast Magazine
Official Nintendo Magazine UK
Official NZ PlayStation Magazine
Official PlayStation 2 Magazine UK
Official Sega Dreamcast Magazine
Official Sega Magazine UK
Official Sega Saturn
Official U.S. PlayStation Magazine
Official UK PlayStation Magazine
Official UK Xbox Magazine
Official Xbox Magazine
P.S.X.
PC Accelerator
PC Gamer
PC Gamer UK
PC Games
PC PowerPlay
PC Zone
PLAY
Play (Australia)
PS Max
PSExtreme
PSM2
Planet Game Boy
Play (UK)
PlayStation Magazine
PlayStation Plus
PlayStation Pro
PlayStation Official Magazine-Australia
PlayStation 2 Official Magazine-Australia
PlayZine
Pocket Gamer
Pocket Games
Polygon
Power
PSW
P2
P3Zine
Pure
Q 64
R-Zone
Raze
S the Sega Magazine
SNES Force
Saturn Plus
Saturn Power
Sega Force
Sega Magazine
Sega Master Force
Sega Power
Sega Pro
Sega Saturn Magazine
Sega Visions
Sega XS
Sega Zone
Silicon Magazine
Station
Super Action
Super Control
Super Gamer
Super Gaming
Super Play
Super Pro
Surge
Team Sega Newsletter
The Games Machine
The Official Australian PlayStation Magazine
Total 64
Total Control
Total Game Boy
Total Gamer
Total Games
Total PlayStation
Total Saturn
Total!
TurboForce
TurboPlay
Ultimate Future Games
Ultimate Gamer
Ultra Game Players
UVGM
VSIXTYFOUR
Video Games Underground
VideoGames & Computer Entertainment/Video Games – the Ultimate Gaming Magazine
Videogame Advisor
Walmart GameCenter
Xbox Live Gamer
Xbox Nation
Games are listed by their official title in North America at the time and in mostly alphabetical order without leading articles. Series with roman numerals or other inconsistencies have been put in an order that hopefully makes sense. The order can look weird with the varied usage of spaces, numbers, colons, and other special characters. Games with the same name on different systems are separated, unless they came out around the same time and are pretty much identical.
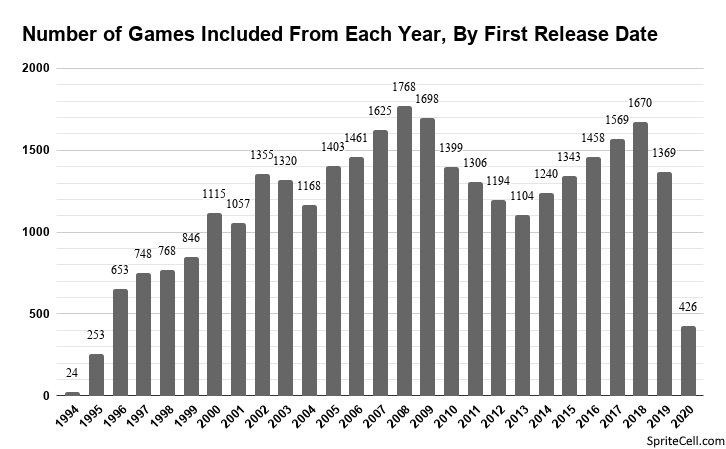
The earliest game included is 1988’s Miracle Warriors: Seal of the Dark Lord, the very first JRPG to reach North America or Europe, while the latest is 2023’s Final Fantasy XVI. There are fewer reviews from after 2010, as there were few magazines left, and even fewer scans available of them. The 1992-2005 era probably has the most coverage.
There are a few anomalies worth noting. Magazines occasionally reviewed games that never came to their region, or never left Japan at all. There are a few retrospective reviews, written years after a game came out. Nintendo Power’s early days threw out review scores inconsistently, sometimes giving scores to games without a written review, or giving scores in a walkthrough. They even reviewed Brandish twice.
You can click on the images to expand them to full size. Pressing the right arrow key or clicking on the right half of the image will go to the next image, while the left arrow key and left half of the image will go to the previous. Pressing escape will close the image lightbox. You may want to open some very large images in a new tab. Filenames start with the the name of the magazine if you ever want to check.
Update Log and Totals
November 29th, 2025 Update
This is a smaller update, but an important one, including 390 new scans. For the first time I have explored PC focused magazines for JRPG reviews. There were a lot fewer of these to be found than I thought there would be. The new 10 magazines added are Computer Games, Computer Entertainer, Games-X, Next3, PC Accelerator, PC Gamer, PC Gamer UK, PC Games, PC PowerPlay, and PC Zone. As far as I can tell only 17 JRPGs were released in English on PCs up through 2014, after which the flood gates opened:
1989: Ancient Land of Ys (NA)
1991: Uncharted Waters (NA only?)
1995: New Horizons (NA only?)
1998: Final Fantasy VII
2000: Final Fantasy VIII
2002: Grandia II
2003: Breath of Fire IV (EU), Final Fantasy XI (NA)
2004: Final Fantasy XI (EU)
2006: Phantasy Star Universe
2009: The Last Remnant
2010: Final Fantasy XIV
2012: Ys: The Oath in Felghana, Dark Souls: Prepare to Die Edition, Half-Minute Hero: Super Mega Neo Climax Ultimate Boy
2013: Final Fantasy XIV: A Realm Reborn
2014: Valkyria Chronicles, Final Fantasy XIII
There may be a few more low profile games added to Steam in this time period, too, but nothing that ever got reviewed. There may also be some MMO or MMO-like games that received English releases, especially ones that were free to play. The above list does not include games from South Korea (TERA and Aion in this time period), but they are included in the archive.
Thanks to the addition of Computer Entertainer we have a new earliest print review of a JRPG. The November, 1988 issue includes two JRPG reviews: Miracle Warriors: Seal of the Dark Lord and Zelda II: The Adventure of Link. Miracle Warriors is the first JRPG to be released in English, so it is nice to have such an early review of it. Something I realized looking through Computer Entertainer is that many of of the late 80s JRPGs were only reviewed in magazines in the early 90s. As far as I can presently tell the first six English language JRPG reviews in print were all in Computer Entertainer. After Miracle Warriors and Zelda II we have Phantasy Star – December 1988, Castlevania II: Simon’s Quest – January 1989, Ys: The Vanished Omens – March 1989, and Legacy of the Wizard – May 1989.
The following 13 games have been added in this update, including two South Korean MMOs:
Aion: The Tower of Eternity, Ancient Land of Ys, Crystal Defenders R1, Dark Souls: Prepare To Die Edition, Genso Suikoden I & II, Grandia II (PC), Legacy of the Wizard, Miracle Warriors: Seal of the Dark Lord, Phantasy Star Online: Blue Burst, Shin Megami Tensei: Devil Survivor 2 Record Breaker, Tengai Makyō II: Manji Maru (DS), TERA, Uncharted Waters (PC)
October 9th, 2024 Update
I was sure that the previous update would be the largest, that there wasn’t much left to add. This update is almost three times as large thanks to a new source of scans with magazines from around the world, because Game Informer has shuttered, and because I decided it was time to go ahead and include GameFan scans. This update has almost doubled the archive’s size. Final Fantasy XVI replaces Soul Hackers 2 as the newest game with a review.
3,316 new scans have been added and about 38 new magazines are included.
I have also updated the navigation on each page to hopefully be more clear and easier to use.
168 new games have reviews:
Collapse/Expand
7th Dragon, Arc the Lad III, ASH: Archaic Sealed Heat, Atelier Ayesha: The Alchemist of Dusk, Atelier Escha & Logy: Alchemists of the Dusk Sky, Atelier Rorona: The Alchemist of Arland, Atelier Rorona Plus: The Alchemist of Arland (PSVita), Atelier Sophie: The Alchemist of the Mysterious Book (PS4), Bahamut Lagoon, Biomotor Unitron, Blazing Souls Accelate, Bloodborne, Bravely Second: End Layer, Castlevania II: Simon’s Quest, Chaos Rings, Code Age Commanders, Code Name: S.T.E.A.M., Conception II: Children of the Seven Stars, Cosmic Star Fantasy, Dark Souls III, Deception IV: Blood Ties, Deception IV: The Nightmare Princess, Demon Gaze, Der Langrisser FX, Digimon Adventure 02: D1 Tamers, Disgaea 4: A Promise Unforgotten, Disgaea 5: Alliance of Vengeance, Disgaea D2: A Brighter Darkness, Disgaea Infinite, Dissidia Final Fantasy NT, Dragon Ball Fusions, Dragon Ball Xenoverse, Dragon Ball Xenoverse 2, Dragon Ball Z Budokai HD Collection, Dragon Quest VIII: Journey of the Cursed King (3DS), Dragon Quest XI: Echoes of an Elusive Age, Dragon Quest Builders, Dragon Quest Heroes: The World Tree’s Woe and the Blight Below, Dragon Quest Heroes II, Dragon Quest: Young Yangus and the Mystery Dungeon, Drakengard 3, Drakerider, Dungeon Fighter Live: Fall of Hendon Myre, Dungeon Fighter Online, Etrian Odyssey Untold: The Millennium Girl, Etrian Odyssey 2 Untold: The Fafnir Knight, Etrian Mystery Dungeon, Ever Oasis, Fairy Fencer F, Fantasy Life, Final Fantasy (WSC), Final Fantasy VI (PS1), Final Fantasy VII (PC), Final Fantasy X/X-2 HD Remaster, Final Fantasy XII: The Zodiac Age, Final Fantasy XIV, Final Fantasy XIV: A Realm Reborn, Final Fantasy XIV: Stormblood, Final Fantasy XV, Final Fantasy XVI, Final Fantasy All the Bravest, Final Fantasy Anniversary Edition, Final Fantasy II Anniversary Edition, Final Fantasy Dimensions, Final Fantasy Legend, Final Fantasy Type-0 HD, Fire Emblem Echoes: Shadows of Valentia, Fire Emblem Fates, Fire Emblem Fates: Birthright, Fire Emblem Fates: Revelation, Fire Emblem Heroes, Fire Emblem Warriors, From the Abyss, Giftpia, God Eater 2: Rage Burst, Grand Kingdom, Gravity Rush, Gravity Rush 2, Growlanser: Heritage of War, Growlanser: Wayfarer of Time, Gurumin: A Monstrous Adventure, Hyperdimension Neptunia U: Action Unleashed, Hyrule Warriors, Hyrule Warriors Legends, I Am Setsuna, Key of Heaven, Kingdom Hearts HD 1.5 Remix, Kingdom Hearts HD 2.5 Remix, Kingdom Hearts HD 2.8 Final Chapter Prologue, Kingdom Hearts Final Mix, Last Rebellion, Mario & Luigi: Dream Team, Monster Farm Battle Card Professional, Monster Hunter 3 Tri, Monster Hunter 4 Ultimate, Monster Hunter Generations, Monster Hunter Stories, Mugen Souls, New Little King’s Story, Ni no Kuni II: Revenant Kingdom, Nier: Automata, Nioh, Odin Sphere Leifthrasir, Ogre Battle Gaiden: Prince of Zenobia, Operation Abyss: New Tokyo Legacy, Paper Mario: Color Splash, Persona 2: Innocent Sin, Persona 5, Persona Q: Shadow of the Labyrinth, Phantasy Star Collection (Saturn), Phantasy Star Portable 2, Pokémon Omega Ruby/Alpha Sapphire, Pokémon Sun/Moon, Pokémon Super Mystery Dungeon, Pokémon X/Y, Pokémon: Let’s Go, Pikachu!/Let’s Go, Eevee!, PoPoLoCrois (PS1), PoPoLoCrois Monogatari II, Project X Zone 2, Puzzle & Dragons Z + Super Mario Bros. Edition, Record of Agarest War 2, Rune Factory 4, Sakura Wars (DC), Senran Kagura 2: Deep Crimson, Shin Megami Tensei IV, Shin Megami Tensei: Persona 3 Portable, Sigma Harmonics, Sorcery Saga: Curse of the Great Curry God, Soul Sacrifice Delta, Star Ocean: Integrity and Faithlessness, Super Robot Wars W, Sword & Sorcery, Sword Art Online: Lost Song, The Sword of Etheria, Tales of Berseria, Tales of Hearts R, Tales of Symphonia Chronicles, Tales of Xillia 2, Tales of Zestiria, Tears to Tiara, Tokyo Mirage Sessions ♯FE, Tokyo Xanadu, Toukiden 2, Toukiden: Kiwami, Treasure Hunter G, Trinity Universe, Utawarerumono: Prelude to the Fallen, Valkyria Revolution, The Witch and the Hundred Knight, Wo Long: Fallen Dynasty, World of Final Fantasy, Xenoblade Chronicles 2, Xenoblade Chronicles 3D, Xenoblade Chronicles X, Xenosaga I & II, Yakuza 0, Yakuza 3, Yakuza 5, Yakuza 6: The Song of Life, Yakuza Kiwami, Yo-Kai Watch, Yo-kai Watch 2: Bony Spirits/Fleshy Souls, Ys V: Lost Kefin, Kingdom of Sand (SNES), Ys V: Lost Kefin, Kingdom of Sand (PS2), Ys: Memories of Celceta, Yu-Gi-Oh! GX Tag Force 2
October 9th, 2023 Update
I expected updates to get smaller and smaller over time, yet this is the largest I have made. 1,151 new page scans have been added. This is mostly due to really going through Out of Print Archive and discovering a mysterious archive. I have also split a few more letter pages and redistributed a few split letters to be more even.
A total of 53 (or so, it became very difficult to keep track of) new magazines now have scans. One of these is WalMart GameCenter, which I wasn’t sure I should include. It is something given away for free by WalMart to entice people to buy games, but it does have the typical sections of a video game magazine, with a smaller page count. There’s typically a single game review per issue and they seem pretty fair and in line with other reviews so I decided to include them. This is the newest magazine included in the archive, making Soul Hackers 2 the newest game to have a review.
Fifty-nine new games have reviews:
Collapse/Expand
Azure Dreams (GBC), Bleach: The 3rd Phantom, Bomberman Tournament, Castlevania: Harmony of Despair, Chrono Trigger (iOS), Crimson Shroud, Crystal Defenders, Dark Arms: Beast Buster 1999, Dragon Ball Z: Budokai Tenkaichi 3 (Wii), Dragon Force II: Kamisarishi Daichi ni, Dragon Quest 25 Shunen Kinen: Famicom & Super Famicom Dragon Quest I·II·III, Dragon Quest Heroes: Rocket Slime, Elden Ring, Final Fantasy IV: The After Years (Wii), Final Fantasy VII Remake, Final Fantasy VIII (PC), Final Fantasy Crystal Chronicles: My Life as a Darklord, Final Fantasy Crystal Chronicles: My Life as a King, Fire Emblem: New Mystery of the Emblem, Fire Emblem: Three Houses, Fossil League: Dino Tournament Championship, Fragile Dreams: Farewell Ruins of the Moon, Genji: Dawn of the Samurai, Genji: Days of the Blade, Graffiti Kingdom, Grandia Digital Museum, Half-Minute Hero: Super Mega Neo Climax, Harvest Moon DS, Inazuma Eleven, Inazuma Eleven 3: Lightning Bolt/Bomb Blast, Knights in the Nightmare (PSP), Kingdom Under Fire: Circle of Doom, The Last Remnant, The Legend of Heroes III: Song of the Ocean, MagnaCarta 2, Monster Hunter Tri G, Monster Hunter: World, Monster Racers, Monster Rancher DS, Mother 3, Ni no Kuni: Dominion of the Dark Djinn, Ninety-Nine Nights II, Octopath Traveler, Phantasy Star II (iOS), Phantasy Star Universe: Ambition of the Illuminus, Pokémon Mystery Dungeon: Explorers of Time/Darkness, Remindelight, Rhapsody: A Musical Adventure (DS), Seiken Densetsu 3, Shining Force (iOS), Soma Bringer, Sorcerian: Shichisei Mahou no Shito, Soul Hackers 2, Spectral Force: Genesis, Valkyria Chronicles II, The World Ends With You: Solo Remix, Yakuza: Dead Souls, Ys Strategy, Zoids Assault
November 28th, 2022 Update
I didn’t expect to ever have more magazines to add, but 6 more are now included. A total of 596 new images have been added and 78 new games. A new letter has also been added: #.
Collapse/Expand
New games: 3D Dot Game Heroes, The 3rd Birthday, Ar Tonelico Qoga: Knell of Ar Ciel, Atelier Meruru: The Apprentice of Arland, Brave Story, Crimson Sea, Crimson Sea 2, Custom Robo (N64), Digimon World: Data Squad, Dissidia 012 Final Fantasy, Dragon’s Crown, Dragon’s Dogma: Dark Arisen, Dragon Quest VI: Realms of Revelation, Dragon Quest IX: Sentinels of the Starry Skies, Dragoneer’s Aria, Drone Tactics, Dungeon Maker: Hunting Ground, Dynasty Warriors: Gundam 3, Etrian Odyssey IV: Legends of the Titan, Fate/Extra, Final Fantasy IV: The Complete Collection, Final Fantasy VI Advance, Final Fantasy XIII, Final Fantasy XIII-2, Fire Emblem: Awakening, Fist of the North Star: Ken’s Rage 2, Fullmetal Alchemist and the Broken Angel, Gods Eater Burst, .Hack//G.U. Vol. 3//Redemption, Hyperdimension Neptunia, Hyperdimension Neptunia mk2, Inuyasha: Secret of the Divine Jewel, Inuyasha: The Secret of the Cursed Mask, Izuna: Legend of the Unemployed Ninja, Kingdom Hearts Re:Coded, The Legend of Heroes: Trails in the Sky, Lunar: Silver Star Harmony, Mana Khemia: Student Alliance, Mega Man Star Force 2: Zerker X Ninja/Zerker X Saurian, Monster Hunter 3 Ultimate, Muramasa Rebirth, Mother 1 + 2, Metal Dungeon, Ni No Kuni: Wrath of the White Witch, Naruto: Path of the Ninja 2, Orphen: Scion of Sorcery, Pandora’s Tower, Persona 4 Golden, Phantasy Star Portable, Pokémon Black Version /White Version, Project X Zone, Pokémon Mystery Dungeon: Gates to Infinity, Radiant Historia, Record of Agarest War, Rune Factory: Tides of Destiny (PS3), Shaman King: Power of Spirit, Shin Megami Tensei: Devil Summoner: Soul Hackers, Star Ocean: The Last Hope, Soul Sacrifice, Summon Night: Swordcraft Story, Summon Night: Twin Age, Stella Deus: The Gate of Eternity, Soul Nomad & the World Eaters, Super Robot Taisen: Original Generation, Tales of Xillia, Tales of Innocence, Tales of Destiny: Director’s Cut, Tales of Graces f, Traysia, Unchained Blades, White Knight Chronicles II, Way of the Samurai 4, Wizardry: Labyrinth of Lost Souls, What Did I Do To Deserve This, My Lord!?, Yu-Gi-Oh! Capsule Monster Coliseum, Yakuza 4, Ys I & II Chronicles
May 6th, 2022 Update
Instead of just using the biggest magazines I have added every English language magazine I can, a total of 46 additional magazines with at least one scan have been added. A total of 824 new images including 132 new games have been added.
Collapse/Expand
New games: Arc Rise Fantasia, Ar tonelico II: Melody of Metafalica, Astonishia Story, Blaze and Blade: Eternal Quest, Baroque, Battle Hunter, Blue Dragon: Awakened Shadow, The Bouncer, Castlevania: Double Pack, Chaos Wars, Class of Heroes, Code of Princess, Crimson Gem Saga, Cross Edge, Dark Souls, Demon’s Souls, Digimon World 2, Digimon World 4, Disgaea 2: Dark Hero Day, Disgaea DS, Dissidia Final Fantasy, Dokapon Kingdom, Dragon Quest Monsters: Joker, Dragon Quest Monsters: Joker 2, Dragon Warrior, Dragon’s Dogma, Drakengard 2, Drakkhen, Dual Hearts, Dungeon Explorer: Warriors of the Ancient Art, Dungeon Maker 2: The Hidden War, Dynasty Tactics, Dynasty Tactics 2, Dynasty Warriors: Gundam 2, Eternal Poison, Eternal Sonata (PS3), Etrian Odyssey III: The Drowned City, Final Fantasy XI: Treasures of Aht Urhgan (PS2), Final Fantasy Crystal Chronicles: The Crystal Bearers, Final Fantasy: The 4 Heroes of Light, Fist of the North Star: Ken’s Rage, Fossil Fighters: Champions, Front Mission (DS), Fullmetal Alchemist 2: Curse of the Crimson Elixir, Generation of Chaos, Glory of Heracles, Golden Sun: Dark Dawn, Guardian Heroes (Xbox 360), Half-Minute Hero, Harvest Moon DS Cute, Harvest Moon: Grand Bazaar, Harvest Moon: More Friends From Mineral Town, Harvest Moon: The Tale of Two Towns DS, Harvest Moon: The Tale of Two Towns 3D, Harvest Moon: Tree of Tranquility, Hexys Force, Hoshigami: Ruining Blue Earth Remix, Infinite Space, Kingdom Hearts 3D: Dream Drop Distance, Kingdom Hearts: Birth by Sleep, Langrisser III, The Last Story, Legaia 2: Duel Saga, Lost in Blue: Shipwrecked, Lufia: Curse of the Sinistrals, Mana Khemia: Alchemists of Al-Revis, Mana Khemia 2: Fall of Alchemy, Mario Tennis: Power Tour, Master of the Monster Lair, Medabots: Infinity, Mega Man Battle Network 5: Double Team DS, Mega Man Battle Network 5: Team Colonel/Team Protoman, Mega Man Battle Network 6: Cybeast Falzar/Cybeast Gregar, Mega Man Star Force: Dragon/Leo/Pegasus, Metal Saga, Monster Hunter Freedom Unite, Monster Hunter Tri, Monster Rancher Evo, Naruto: Path of the Ninja, Nier, One Piece: Unlimited Adventure, Operation Darkness, Paper Mario: Sticker Star, Phantasy Star Online Ver. 2, Phantasy Star Online: Episode I & II Plus, Pokémon Black Version 2/White Version 2, Pokémon Conquest, Pokémon HeartGold Version/SoulSilver Version, Pokémon Ranger: Guardian Signs, Pokémon Ranger: Shadows of Almia, Ragnarok DS, Record of Agarest War, Resonance of Fate (PS3), River King: Mystic Valley, Riviera: The Promised Land, Rondo of Swords, Rune Factory: A Fantasy Harvest Moon, Rune Factory 3: A Fantasy Harvest Moon, Rune Factory: Tides of Destiny (Wii), Sakura Wars: So Long, My Love, Sands of Destruction, Shaman King: Legacy of the Spirits, Soaring Hawk/Sprinting Wolf, Shaman King: Master of Spirits, Shaman King: Master of Spirits 2, Shin Megami Tensei: Devil Summoner 2, Shin Megami Tensei: Devil Survivor 2, Shin Megami Tensei: Devil Survivor Overclocked, Shin Megami Tensei: Persona, Shin Megami Tensei: Strange Journey, Shiren the Wanderer, Solatorobo: Red the Hunter, Spectral Force 3, Spectral Souls: Resurrection of the Ethereal Empires, Spectrobes: Beyond the Portals, Star Ocean: Second Evolution, Star Ocean: The Last Hope International, Steambot Chronicles, Tales of Symphonia: Dawn of the New World, Tales of the Abyss (3DS), Trinity: Souls of Zill Ơll, Uncharted Waters (SNES), Valhalla Knights 2, Way of the Samurai 3, White Knight Chronicles, Xenoblade Chronicles, Yakuza 2, Ys Seven, Ys: The Oath in Felghana, Yu-Gi-Oh! Reshef of Destruction, Yu-Gi-Oh! The Falsebound Kingdom, Yu-Gi-Oh! The Sacred Cards, Z.H.P. Unlosing Ranger VS Darkdeath Evilman, Zoids: Legacy
November 22nd, 2021 Update
26 games have had new reviews added, and 12 new games have been added: Castlevania: Circle of the Moon, Car Battler Joe, Dragon Ball Z: Legendary Super Warrior, Dragon Warrior III, Exile, Faxanadu, Lufia: The Legend Returns, Metal Gear Ac!d, Mystic Heroes, Pokémon Crystal Version, Ring of Red, Star Ocean: First Departure
Totals
Total Images: 7,566
Total Games: 978
Total Games with a Colon in the Title: 380
Total Magazines: 170
# – 4 Games
A – 36 games
- Advance Guardian Heroes
- Advance Wars: Days of Ruin
- Advance Wars: Dual Strike
- Aedis Eclipse: Generation of Chaos
- Aion: The Tower of Eternity
- Albert Odyssey: Legend of Eldean
- Alundra
- Alundra 2
- Ancient Land of Ys
- Arcana
- Arc Rise Fantasia
- Arc the Lad
- Arc the Lad III
- Arc the Lad Collection
- Arc the Lad: End of Darkness
- Arc the Lad: Twilight of the Spirits
- Ar Tonelico: Melody of Elemia
- Ar Tonelico II: Melody of Metafalica
- Ar Tonelico Qoga: Knell of Ar Ciel
- ASH: Archaic Sealed Heat
- Astonishia Story
- Atelier Annie: Alchemists of Sera Island
- Atelier Ayesha: The Alchemist of Dusk
- Atelier Escha & Logy: Alchemists of the Dusk Sky
- Atelier Iris: Eternal Mana
- Atelier Iris 2: The Azoth of Destiny
- Atelier Iris 3: Grand Phantasm
- Atelier Meruru: The Apprentice of Arland
- Atelier Rorona: The Alchemist of Arland
- Atelier Rorona Plus: The Alchemist of Arland (PSVita)
- Atelier Sophie: The Alchemist of the Mysterious Book (PS4)
- Avalon Code
- Away: Shuffle Dungeon
- Ax Battler: A Legend of Golden Axe
- Azure Dreams (PS1)
- Azure Dreams (GBC)
B Part 1 – 19 games
- Bahamut Lagoon
- Baroque
- Baten Kaitos: Eternal Wings and the Lost Ocean
- Baten Kaitos Origins
- Battle Hunter
- Beyond Oasis
- Beyond the Beyond
- Biomotor Unitron
- Blade Dancer: Lineage of Light
- Bladestorm: The Hundred Years’ War
- Blaze and Blade: Eternal Quest
- Blazing Souls Accelate
- Bleach: The 3rd Phantom
- Bloodborne
- Blue Dragon
- Blue Dragon Plus
- Blue Dragon: Awakened Shadow
- Boktai: The Sun is in Your Hand
- Boktai 2: Solar Boy Django
B Part 2 – 17 games
- Bomberman Tournament
- The Bouncer
- Brain Lord
- Brandish
- Brave Fencer Musashi
- Brave Story
- Bravely Default
- Bravely Second: End Layer
- Breath of Fire (SNES)
- Breath of Fire (GBA)
- Breath of Fire II (SNES)
- Breath of Fire II (GBA)
- Breath of Fire III (PS1)
- Breath of Fire III (PSP)
- Breath of Fire IV (PS1/PC)
- Breath of Fire: Dragon Quarter
- Brigandine
C Part 1 – 18 games
- Cadash (TurboGrafx/Genesis)
- Car Battler Joe
- Castlevania II: Simon’s Quest
- Castlevania: Aria of Sorrow
- Castlevania: Circle of the Moon
- Castlevania: Curse of Darkness
- Castlevania: Dawn of Sorrow
- Castlevania: Double Pack
- Castlevania: Harmony of Despair
- Castlevania: Harmony of Dissonance
- Castlevania: Order of Ecclesia
- Castlevania: Portrait of Ruin
- Castlevania: Symphony of the Night
- Castlevania: The Dracula X Chronicles
- Chaos Rings
- Chaos Wars
- Children of Mana
- Chocobo’s Dungeon 2
C Part 2 – 28 games
- Chrono Cross
- Chrono Trigger (SNES)
- Chrono Trigger (DS)
- Chrono Trigger (iOS)
- CIMA: The Enemy
- Code Age Commanders
- Code Name: S.T.E.A.M.
- Class of Heroes
- Code of Princess
- Conception II: Children of the Seven Stars
- Contact
- Cosmic Fantasy 2
- Cosmic Star Fantasy
- Crimson Gem Saga
- Crimson Sea
- Crimson Sea 2
- Crimson Shroud
- Crimson Tears
- Crisis Core: Final Fantasy VII
- Cross Edge
- Crystal Defenders (Xbox 360)
- Crystal Defenders R1
- Crystal Warriors
- Crystalis (NES)
- Crystalis (GBC)
- Cubivore
- Custom Robo (N64)
- Custom Robo Arena
D Part 1 – 56 games
- Dark Arms: Beast Buster 1999
- Dark Cloud
- Dark Cloud 2
- Dark Savior
- Dark Souls (PS3/Xbox 360)
- Dark Souls: Prepare To Die Edition
- Dark Souls II (PS3/Xbox 360/PC)
- Dark Souls III
- The Dark Spire
- Dark Wizard
- Dawn of Mana
- Deception III: Dark Delusion
- Deception IV: Blood Ties
- Deception IV: The Nightmare Princess
- Deep Labyrinth
- Defenders of Oasis
- DemiKids Light Version/Dark Version
- Demon Gaze
- Demon’s Souls (PS3)
- Der Langrisser FX
- Destiny of an Emperor
- Digimon Adventure 02: D1 Tamers
- Digimon World
- Digimon World 2
- Digimon World 3
- Digimon World 4
- Digimon World: Data Squad
- Dirge of Cerberus: Final Fantasy VII
- Disgaea: Afternoon of Darkness
- Disgaea: Hour of Darkness (PS2)
- Disgaea 2: Cursed Memories (PS2)
- Disgaea 2: Dark Hero Days
- Disgaea 3: Absence of Justice (PS3/PSVita)
- Disgaea 4: A Promise Unforgotten
- Disgaea 5: Alliance of Vengeance
- Disgaea D2: A Brighter Darkness
- Disgaea DS
- Disgaea Infinite
- Dissidia 012 Final Fantasy
- Dissidia Final Fantasy
- Dissidia Final Fantasy NT
- Dokapon: Monster Hunter
- Dokapon Journey
- Dokapon Kingdom
- Dragon Ball Fusions
- Dragon Ball Xenoverse
- Dragon Ball Xenoverse 2
- Dragon Ball Z Budokai HD Collection
- Dragon Ball Z: Budokai Tenkaichi 2 (PS2)
- Dragon Ball Z: Budokai Tenkaichi 2 (Wii)
- Dragon Ball Z: Budokai Tenkaichi 3 (PS2)
- Dragon Ball Z: Budokai Tenkaichi 3 (Wii)
- Dragon Ball Z: Legendary Super Warrior
- Dragon Crystal
- Dragon Force
- Dragon Force II: Kamisarishi Daichi ni
D Part 2 – 54 Games
- Dragon Quest IV: Chapters of the Chosen
- Dragon Quest V: Hand of the Heavenly Bride
- Dragon Quest VI: Realms of Revelation
- Dragon Quest VIII: Journey of the Cursed King (PS2)
- Dragon Quest VIII: Journey of the Cursed King (3DS)
- Dragon Quest IX: Sentinels of the Starry Skies
- Dragon Quest XI: Echoes of an Elusive Age (PS4)
- Dragon Quest 25 Shunen Kinen: Famicom & Super Famicom Dragon Quest I·II·III
- Dragon Quest Builders
- Dragon Quest Heroes: Rocket Slime
- Dragon Quest Heroes: The World Tree’s Woe and the Blight Below
- Dragon Quest Heroes II
- Dragon Quest Monsters: Joker
- Dragon Quest Monsters: Joker 2
- Dragon Quest Swords: The Masked Queen and the Tower of Mirrors
- Dragon Quest: Young Yangus and the Mystery Dungeon
- Dragon Slayer: The Legend of Heroes
- Dragon Valor
- Dragon View
- Dragon Warrior
- Dragon Warrior I & II
- Dragon Warrior II
- Dragon Warrior III (NES)
- Dragon Warrior III (GBC)
- Dragon Warrior IV
- Dragon Warrior VII
- Dragon Warrior Monsters
- Dragon Warrior Monsters 2
- Dragon’s Crown
- Dragon’s Dogma (PS3/Xbox 360)
- Dragon’s Dogma: Dark Arisen (PS3/Xbox 360)
- Dragoneer’s Aria
- Dragonseeds
- Drakengard
- Drakengard 2
- Drakengard 3
- Drakerider
- Drakkhen
- Drone Tactics
- Dual Hearts
- Dungeon Explorer
- Dungeon Explorer: Warriors of the Ancient Arts (DS)
- Dungeon Explorer: Warriors of the Ancient Arts (PSP)
- Dungeon Explorer II
- Dungeon Fighter Live: Fall of Hendon Myre
- Dungeon Fighter Online
- Dungeon Magic
- Dungeon Maker: Hunting Ground
- Dungeon Maker 2: The Hidden War
- Dynasty Tactics
- Dynasty Tactics 2
- Dynasty Warriors: Gundam
- Dynasty Warriors: Gundam 2
- Dynasty Warriors: Gundam 3
E – 28 games
- EarthBound
- Ehrgeiz
- Elden Ring
- Elemental Gearbolt
- Elemental Gimmick Gear
- Enchanted Arms (PS3/Xbox 360)
- Ephemeral Fantasia
- Eternal Eyes
- Eternal Poison
- Eternal Ring
- Eternal Sonata (Xbox 360)
- Eternal Sonata (PS3)
- Etrian Odyssey
- Etrian Odyssey II: Heroes of Lagaard
- Etrian Odyssey III: The Drowned City
- Etrian Odyssey IV: Legends of the Titan
- Etrian Odyssey Untold: The Millennium Girl
- Etrian Odyssey 2 Untold: The Fafnir Knight
- Etrian Mystery Dungeon
- Ever Oasis
- Evergrace
- E.V.O.: Search for Eden
- Evolution Worlds
- Evolution: The World of Sacred Device
- Evolution 2: Far Off Promise (DC)
- Exile (Genesis)
- Exile (TurboGrafx)
- Exile: Wicked Phenomenon
F Part 1 – 28 games
- Fairy Fencer F
- Fantasy Life
- Faria: A World of Mystery and Danger!
- Fatal Labyrinth
- Fate/Extra
- Faxanadu
- Final Fantasy (NES)
- Final Fantasy (WSC)
- Final Fantasy (PSP)
- Final Fantasy I & II: Dawn of Souls
- Final Fantasy II (now IV) (SNES)
- Final Fantasy II (PSP)
- Final Fantasy II (WSC)
- Final Fantasy III (now VI) (SNES/PS3)
- Final Fantasy III (DS)
- Final Fantasy IV (DS/PSP)
- Final Fantasy IV Advance
- Final Fantasy IV: The After Years (Wii)
- Final Fantasy IV: The Complete Collection
- Final Fantasy V Advance
- Final Fantasy VI (PS1)
- Final Fantasy VI Advance
- Final Fantasy VII (PS1)
- Final Fantasy VII (PC)
- Final Fantasy VII Remake
- Final Fantasy VIII (PS1)
- Final Fantasy VIII (PC)
- Final Fantasy IX (PS1)
F Part 2 – 33 games
- Final Fantasy X (PS2)
- Final Fantasy X-2 (PS2)
- Final Fantasy X/X-2 HD Remaster
- Final Fantasy XI Online (PS2/PC)
- Final Fantasy XI Online (Xbox 360)
- Final Fantasy XI: Chains of Promathia (PS2/PC)
- Final Fantasy XI: Treasures of Aht Urhgan (PS2/PC)
- Final Fantasy XI: Wings of the Goddess (PS2, Xbox 360, PC)
- Final Fantasy XII
- Final Fantasy XII: Revenant Wings
- Final Fantasy XII: The Zodiac Age
- Final Fantasy XIII
- Final Fantasy XIII-2
- Final Fantasy XIV
- Final Fantasy XIV: A Realm Reborn
- Final Fantasy XIV: Stormblood
- Final Fantasy XV
- Final Fantasy XVI
- Final Fantasy Adventure
- Final Fantasy All the Bravest
- Final Fantasy Anniversary Edition
- Final Fantasy II Anniversary Edition
- Final Fantasy Anthology
- Final Fantasy Chronicles
- Final Fantasy Dimensions
- Final Fantasy Explorers
- Final Fantasy Fables: Chocobo Tales
- Final Fantasy Fables: Chocobo’s Dungeon
- Final Fantasy Legend
- Final Fantasy Legend II
- Final Fantasy Legend III
- Final Fantasy Mystic Quest
- Final Fantasy Origins
F Part 3 – 41 games
- Final Fantasy Tactics
- Final Fantasy Tactics Advance
- Final Fantasy Tactics A2: Grimoire of the Rift
- Final Fantasy Tactics: The War of the Lions
- Final Fantasy Type-0 HD
- Final Fantasy: The 4 Heroes of Light
- Final Fantasy: Crystal Chronicles (GC)
- Final Fantasy Crystal Chronicles: Echoes of Time (DS/Wii)
- Final Fantasy Crystal Chronicles: My Life as a Darklord
- Final Fantasy Crystal Chronicles: My Life as a King
- Final Fantasy Crystal Chronicles: Ring of Fates
- Final Fantasy Crystal Chronicles: The Crystal Bearers
- Fire Emblem
- Fire Emblem Echoes: Shadows of Valentia
- Fire Emblem Fates
- Fire Emblem Fates: Birthright
- Fire Emblem Fates: Revelation
- Fire Emblem Heroes
- Fire Emblem Warriors
- Fire Emblem: Awakening
- Fire Emblem: New Mystery of the Emblem
- Fire Emblem: Path of Radiance
- Fire Emblem: Radiant Dawn
- Fire Emblem: Shadow Dragon
- Fire Emblem: The Sacred Stones
- Fire Emblem: Three Houses
- Fist of the North Star: Ken’s Rage
- Fist of the North Star: Ken’s Rage 2
- Folklore
- Forever Kingdom
- Fossil Fighters
- Fossil Fighters: Champions
- Fossil League: Dino Tournament Championship
- Fragile Dreams: Farewell Ruins of the Moon
- From the Abyss
- Front Mission (SNES)
- Front Mission (DS)
- Front Mission 3
- Front Mission 4
- Fullmetal Alchemist and the Broken Angel
- Fullmetal Alchemist 2: Curse of the Crimson Elixir
G – 35 games
- Generation of Chaos
- Genji: Dawn of the Samurai
- Genji: Days of the Blade
- Gensō Suikoden I & II
- Giftpia
- Glory of Heracles
- God Eater 2: Rage Burst
- Gods Eater Burst
- Golden Sun
- Golden Sun: Dark Dawn
- Golden Sun: The Lost Age
- Graffiti Kingdom
- Grand Kingdom
- Grandia (Saturn)
- Grandia (PS1)
- Grandia II (DC)
- Grandia II (PC)
- Grandia II (PS2)
- Grandia III
- Grandia Digital Museum
- Grandia Xtreme
- The Granstream Saga
- Gravity Rush
- Gravity Rush 2
- Great Greed
- GrimGrimoire (PS2)
- Growlanser: Generations
- Growlanser: Heritage of War
- Growlanser: Wayfarer of Time (PSP)
- Guardian Heroes (Saturn)
- Guardian Heroes (Xbox 360)
- Guardian War
- Guardian’s Crusade
- Gungnir
- Gurumin: A Monstrous Adventure
H – 33 games
- .Hack Part 1: Infection
- .Hack Part 2: Mutation
- .Hack Part 3: Outbreak
- .Hack Part 4: Quarantine
- .Hack//G.U. Vol. 1//Rebirth
- .Hack//G.U. Vol. 2//Reminiscence
- .Hack//G.U. Vol. 3//Redemption
- Half-Minute Hero
- Half-Minute Hero: Super Mega Neo Climax
- Harvest Moon DS
- Harvest Moon DS Cute
- Harvest Moon DS: Grand Bazaar
- Harvest Moon: Animal Parade
- Harvest Moon: Back to Nature
- Harvest Moon: Friends of Mineral Town
- Harvest Moon: Island of Happiness
- Harvest Moon: More Friends From Mineral Town
- Harvest Moon: Sunshine Islands
- Harvest Moon: The Tale of Two Towns DS
- Harvest Moon: The Tale of Two Towns 3D
- Harvest Moon: Tree of Tranquility
- Heroes of Mana
- Hero’s Saga
- Hexys Force
- Hoshigami: Ruining Blue Earth
- Hoshigami: Ruining Blue Earth Remix
- Hybrid Heaven
- Hydlide
- Hyperdimension Neptunia
- Hyperdimension Neptunia mk2
- Hyperdimension Neptunia U: Action Unleashed
- Hyrule Warriors
- Hyrule Warriors Legends
I – 12 games
- I Am Setsuna
- Illusion of Gaia
- Inazuma Eleven
- Inazuma Eleven 3: Lightning Bolt/Bomb Blast
- Infinite Space
- Infinite Undiscovery
- Inindo
- Innocent Life: A Futuristic Harvest Moon
- Inuyasha: Secret of the Divine Jewel
- Inuyasha: The Secret of the Cursed Mask
- Izuna: Legend of the Unemployed Ninja
- Izuna 2: The Unemployed Ninja Returns
J – 3 games
K – 25 games
- Kagero: Deception II
- Kartia: The Word of Fate
- Key of Heaven
- Kingdom Hearts
- Kingdom Hearts 358/2 Days
- Kingdom Hearts 3D: Dream Drop Distance
- Kingdom Hearts II
- Kingdom Hearts HD 1.5 Remix
- Kingdom Hearts HD 2.5 Remix
- Kingdom Hearts HD 2.8 Final Chapter Prologue
- Kingdom Hearts Final Mix
- Kingdom Hearts Re: Chain of Memories
- Kingdom Hearts: Birth by Sleep
- Kingdom Hearts Re:Coded
- Kingdom Hearts: Chain of Memories
- Kingdom of Paradise
- Kingdom Under Fire: Circle of Doom
- King’s Field (Japan)
- King’s Field (North America)
- King’s Field II
- King’s Field: The Ancient City
- Knight Quest
- Knights in the Nightmare (DS)
- Knights in the Nightmare (PSP)
- Koudelka
L Part 1 – 25 games
- La Pucelle: Tactics
- Lagoon
- Langrisser III
- Last Rebellion
- The Last Remnant
- The Last Story
- Legacy of the Wizard
- Legacy of Ys: Books I & II
- Legaia 2: Duel Saga
- Legasista
- The Legend of Dragoon
- Legend of Legaia
- The Legend of Heroes: A Tear of Vermillion
- The Legend of Heroes II: Prophecy of the Moonlight Witch
- The Legend of Heroes III: Song of the Ocean
- The Legend of Heroes: Trails in the Sky
- Legend of Mana (PS1)
- Legend of Oasis
- The Legend of the Ghost Lion
- Legend of the River King
- Legend of the River King 2
- Lightning Returns: Final Fantasy XIII (PS3/Xbox 360)
- Little King’s Story (Wii)
- Little Ninja Brothers
- Lord of Arcana
L Part 2 – 25 games
- Lost Kingdoms
- Lost Kingdoms II
- Lost in Blue
- Lost in Blue 2
- Lost in Blue 3
- Lost in Blue: Shipwrecked
- LostMagic
- Lost Odyssey
- Lost Sphear
- Lucienne’s Quest
- Lufia & the Fortress of Doom
- Lufia II: Rise of the Sinistrals
- Lufia: Curse of the Sinistrals
- Lufia: The Legend Returns
- Lufia: The Ruins of Lore
- Luminous Arc
- Luminous Arc 2
- Lunar Knights
- Lunar Legend
- Lunar 2: Eternal Blue Complete
- Lunar: Dragon Song
- Lunar: Eternal Blue
- Lunar: Silver Star Harmony
- Lunar: Silver Star Story Complete (PS1)
- Lunar: The Silver Star
M Part 1 – 35 games
- Magical Starsign
- Magician’s Quest: Mysterious Times
- Magic Knight Rayearth
- The Magic of Scheherazade
- Magic Pengel: The Quest for Color
- Magna Carta: Tears of Blood
- MagnaCarta 2
- Makai Kingdom: Chronicles of the Sacred Tome
- Mana Khemia: Alchemists of Al-Revis
- Mana Khemia: Student Alliance
- Mana Khemia 2: Fall of Alchemy
- Mario Golf (GBC)
- Mario Golf: Advance Tour
- Mario Tennis (GBC)
- Mario Tennis: Power Tour
- Mario & Luigi: Bowser’s Inside Story
- Mario & Luigi: Dream Team
- Mario & Luigi: Paper Jam
- Mario & Luigi: Partners in Time
- Mario & Luigi: Superstar Saga
- Master of Monsters: Disciples of Gaia
- Master of the Monster Lair
- Medabots: Infinity
- Medabots: Metabee Version/Rokusho Version
- Mega Man Battle Network
- Mega Man Battle Network 2
- Mega Man Battle Network 3: Blue Version/White Version
- Mega Man Battle Network 4: Red Sun/Blue Moon
- Mega Man Battle Network 5: Double Team DS
- Mega Man Battle Network 5: Team Colonel/Team Protoman
- Mega Man Battle Network 6: Cybeast Falzar/Cybeast Gregar
- Mega Man Star Force: Dragon/Leo/Pegasus
- Mega Man Star Force 2: Zerker X Ninja/Zerker X Saurian
- Mega Man Star Force 3: Red Joker/Black Ace
- Mega Man X: Command Mission (PS2/GC)
M Part 2 – 43 games
- Metal Dungeon
- Metal Gear Ac!d
- Metal Gear Ac!d 2
- Metal Saga
- Metal Walker
- Miracle Warriors: Seal of the Dark Lord
- Monster Farm Battle Card Professional
- Monster Hunter
- Monster Hunter 3 Tri
- Monster Hunter 3 Ultimate
- Monster Hunter 4 Ultimate
- Monster Hunter Freedom
- Monster Hunter Freedom Unite
- Monster Hunter Freedom 2
- Monster Hunter Generations
- Monster Hunter Stories
- Monster Hunter Tri
- Monster Hunter Tri G
- Monster Hunter: World
- Monster Kingdom Jewel Summoner
- Monster Racers
- Monster Rancher
- Monster Rancher 2
- Monster Rancher 3
- Monster Rancher 4
- Monster Rancher Advance
- Monster Rancher Advance 2
- Monster Rancher Battle Card
- Monster Rancher Battle Card: Episode II
- Monster Rancher DS
- Monster Rancher Evo
- Monster Seed
- Mother 1 + 2
- Mother 3
- MS Saga: A New Dawn
- Mugen Souls
- Muramasa Rebirth
- Muramasa: The Demon Blade
- Musashi: Samurai Legend
- Mystaria: The Realms of Lore
- Mystery Dungeon: Shiren the Wanderer
- Mystic Heroes
- My World, My Way
N – 15 games
- Naruto: Path of the Ninja
- Naruto: Path of the Ninja 2
- New Little King’s Story
- Ni no Kuni II: Revenant Kingdom
- Ni no Kuni: Dominion of the Dark Djinn
- Ni No Kuni: Wrath of the White Witch (PS3)
- Nier
- Nier: Automata
- Nightmare of Druaga
- Ninety-Nine Nights
- Ninety-Nine Nights II
- Ninja Boy 2
- Ninja Taro
- Nioh
- Nostalgia
O – 15 games
- Octopath Traveler
- Odin Sphere
- Odin Sphere Leifthrasir
- Ogre Battle 64: Person of Lordly Caliber
- Ogre Battle Gaiden: Prince of Zenobia
- Ogre Battle: Limited Edition
- Ogre Battle: The March of the Black Queen (SNES)
- Ogre Battle: The March of the Black Queen (Saturn)
- Okage: Shadow King
- One Piece: Unlimited Adventure
- Onimusha Tactics
- Operation Abyss: New Tokyo Legacy
- Operation Darkness
- Opoona
- Orphen: Scion of Sorcery
P Part 1 – 14 games
- Paladin’s Quest
- Pandora’s Tower
- Panzer Dragoon Saga
- Paper Mario
- Paper Mario: Color Splash
- Paper Mario: The Thousand-Year Door
- Paper Mario: Sticker Star
- Parasite Eve
- Parasite Eve II
- Persona 2: Eternal Punishment (PS1)
- Persona 2: Innocent Sin
- Persona 4 Golden
- Persona 5
- Persona Q: Shadow of the Labyrinth
P Part 2 – 21 games
- Phantasy Star
- Phantasy Star II (Genesis)
- Phantasy Star II (iOS)
- Phantasy Star III: Generations of Doom
- Phantasy Star IV: The End of the Millennium
- Phantasy Star Collection (GBA)
- Phantasy Star Collection (Saturn)
- Phantasy Star Online (DC/PS2/Xbox)
- Phantasy Star Online Ver. 2
- Phantasy Star Online: Blue Burst
- Phantasy Star Online: Episode I & II (Xbox/GC)
- Phantasy Star Online: Episode I & II Plus
- Phantasy Star Online Episode III: C.A.R.D. Revolution
- Phantasy Star Portable
- Phantasy Star Portable 2
- Phantasy Star Universe (Xbox 360/PS2/PC)
- Phantasy Star Universe: Ambition of the Illuminus
- Phantasy Star Ø
- Phantom Brave
- Phantom Brave: We Meet Again
- Pocket Kingdom: Own the World
P Part 3 – 35 games
- Pokémon Black Version/White Version
- Pokémon Black Version 2/White Version 2
- Pokémon Colosseum
- Pokémon Conquest
- Pokémon Crystal Version
- Pokémon Diamond Version/Pearl Version
- Pokémon Emerald Version
- Pokémon Gold Version/Silver Version
- Pokémon HeartGold Version/SoulSilver Version
- Pokémon FireRed Version/LeafGreen Version
- Pokémon Mystery Dungeon: Blue Rescue Team
- Pokémon Mystery Dungeon: Explorers of Sky
- Pokémon Mystery Dungeon: Explorers of Time/Darkness
- Pokémon Mystery Dungeon: Gates to Infinity
- Pokémon Mystery Dungeon: Red Rescue Team
- Pokémon Omega Ruby/Alpha Sapphire
- Pokémon Platinum Version
- Pokémon Ranger
- Pokémon Ranger: Guardian Signs
- Pokémon Ranger: Shadows of Almia
- Pokémon Red Version/Blue Version
- Pokémon Ruby Version/Sapphire Version
- Pokémon Stadium
- Pokémon Sun/Moon
- Pokémon Super Mystery Dungeon
- Pokémon X/Y
- Pokémon Yellow Version: Special Pikachu Edition
- Pokémon XD: Gale of Darkness
- Pokémon: Let’s Go, Pikachu!/Let’s Go, Eevee!
- PoPoLoCrois (PS1)
- PoPoLoCrois (PSP)
- PoPoLoCrois Monogatari II
- Project X Zone
- Project X Zone 2
- Puzzle & Dragons Z + Super Mario Bros. Edition
Q – 1 game
R – 32 games
- Radiant Historia
- Radiata Stories
- Ragnarok DS
- Record of Agarest War
- Record of Agarest War Zero
- Record of Agarest War 2
- Record of Lodoss War
- Remindelight
- Rengoku: The Tower of Purgatory
- Rengoku II: The Stairway to H.E.A.V.E.N.
- Resonance of Fate (PS3/Xbox 360)
- Revelations: Persona
- Revelations: The Demon Slayer
- Rhapsody: A Musical Adventure (PS1)
- Rhapsody: A Musical Adventure (DS)
- Ring of Red
- River King: Mystic Valley
- Riviera: The Promised Land
- Robopon Sun Version/Star Version/Moon Version
- Robopon 2: Cross Version/Ring Version
- Robot Warlords
- Robotrek
- Rogue Galaxy
- Romancing Saga
- Rondo of Swords
- Rune Factory: A Fantasy Harvest Moon
- Rune Factory 2: A Fantasy Harvest Moon
- Rune Factory 3: A Fantasy Harvest Moon
- Rune Factory 4
- Rune Factory Frontier
- Rune Factory: Tides of Destiny (PS3)
- Rune Factory: Tides of Destiny (Wii)
S Part 1 – 31 games
- Saga Frontier (PS1)
- Saga Frontier 2 (PS1)
- Saiyuki: Journey West
- Sakura Wars (DC)
- Sakura Wars: So Long, My Love
- Sands of Destruction
- Secret of Evermore
- Secret of Mana
- Secret of the Stars
- Seiken Densetsu 3
- Senran Kagura 2: Deep Crimson
- Seventh Cross Evolution
- Shadow Hearts
- Shadow Hearts: Covenant
- Shadow Hearts: From the New World
- Shadow Tower
- Shaman King: Legacy of the Spirits, Soaring Hawk/Sprinting Wolf
- Shaman King: Master of Spirits
- Shaman King: Master of Spirits 2
- Shaman King: Power of Spirit
- Shin Megami Tensei IV
- Shin Megami Tensei: Devil Summoner: Raidou Kuzunoha vs. the Soulless Army
- Shin Megami Tensei: Devil Summoner 2: Raidou Kuzunoha vs. King Abaddon
- Shin Megami Tensei: Devil Summoner: Soul Hackers
- Shin Megami Tensei: Devil Survivor
- Shin Megami Tensei: Devil Survivor 2
- Shin Megami Tensei: Devil Survivor 2 Record Breaker
- Shin Megami Tensei: Devil Survivor Overclocked
- Shin Megami Tensei: Digital Devil Saga
- Shin Megami Tensei: Digital Devil Saga 2
- Shin Megami Tensei: Nocturne
S Part 2 – 25 games
- Shin Megami Tensei: Persona
- Shin Megami Tensei: Persona 3
- Shin Megami Tensei: Persona 3 FES
- Shin Megami Tensei: Persona 3 Portable
- Shin Megami Tensei: Persona 4
- Shin Megami Tensei: Strange Journey
- Shining Force (Genesis)
- Shining Force (iOS)
- Shining Force CD
- Shining Force Exa
- Shining Force Neo
- Shining Force: Resurrection of the Dark Dragon
- Shining Force: The Sword of Hajya
- Shining Force II
- Shining Force III
- Shining in the Darkness
- Shining Soul
- Shining Soul II
- Shining Tears
- Shining the Holy Ark
- Shining Wisdom
- Shiren the Wanderer
- Sigma Harmonics
- Skies of Arcadia
- Skies of Arcadia Legends
S Part 3 – 52 games
- Solatorobo: Red the Hunter
- Soma Bringer
- Song Summoner: The Unsung Heroes
- Sorcerer’s Kingdom
- Sorcerian: Shichisei Mahou no Shito
- Sorcery Saga: Curse of the Great Curry God
- Soul Blazer
- Soul Hackers 2
- Soul Nomad & the World Eaters
- Soul Sacrifice
- Soul Sacrifice Delta
- Spectral Force: Genesis
- Spectral Souls
- Spectral Souls: Resurrection of the Ethereal Empires
- Spectrobes: Beyond the Portals
- Spectrobes: Origins
- SpellCaster
- Star Ocean: First Departure
- Star Ocean: Integrity and Faithlessness
- Star Ocean: Second Evolution
- Star Ocean: The Last Hope
- Star Ocean: The Last Hope International
- Star Ocean: The Second Story
- Star Ocean: Till the End of Time
- Steambot Chronicles
- Stella Deus: The Gate of Eternity
- Suikoden
- Suikoden II
- Suikoden III
- Suikoden IV
- Suikoden V
- Suikoden Tactics
- Suikoden: Tierkreis
- Summon Night: Swordcraft Story
- Summon Night: Swordcraft Story 2
- Summon Night: Twin Age
- Super Hydlide
- Super Mario RPG: Legend of the Seven Stars
- Super Ninja Boy
- Super Paper Mario
- Super Robot Taisen OG Saga: Endless Frontier
- Super Robot Taisen: Original Generation
- Super Robot Taisen: Original Generation 2
- Super Robot Wars W
- Sword & Sorcery
- Sword Art Online: Lost Song
- The Sword of Etheria
- The Sword of Hope
- The Sword of Hope II
- Sword of Mana
- Sword of Vermilion
T – 46 games
- Tactics Ogre (PS1)
- Tactics Ogre: Let Us Cling Together
- Tactics Ogre: The Knight of Lodis
- Tail of the Sun
- Tales of Berseria
- Tales of Destiny
- Tales of Destiny: Director’s Cut
- Tales of Destiny 2
- Tales of Graces f
- Tales of Hearts R
- Tales of Innocence
- Tales of Legendia
- Tales of Phantasia (SNES)
- Tales of Phantasia (GBA)
- Tales of Symphonia (GC)
- Tales of Symphonia Chronicles
- Tales of Symphonia: Dawn of the New World
- Tales of the Abyss (PS2)
- Tales of the Abyss (3DS)
- Tales of the World: Radiant Mythology
- Tales of Vesperia (Xbox 360)
- Tales of Xillia
- Tales of Xillia 2
- Tales of Zestiria
- Tao’s Adventure: Curse of the Demon Seal
- Tears to Tiara
- Tecmo’s Deception: Invitation to Darkness
- Tengai Makyō II: Manji Maru (DS)
- TERA
- Terranigma
- Thousand Arms
- Threads of Fate
- Time Stalkers
- Tobal No. 1
- Tokyo Mirage Sessions ♯FE
- Tokyo Xanadu
- Torneko: The Last Hope
- Trapt
- Toukiden 2
- Toukiden: Kiwami
- Traysia
- Treasure Hunter G
- Trinity Universe
- Trinity: Souls of Zill Ơll
- Tsugunai: Atonement
- The Twisted Tales of Spike McFang
U – 7 games
- Unchained Blades
- Uncharted Waters (NES)
- Uncharted Waters (SNES)
- Uncharted Waters (PC)
- Uncharted Waters: New Horizons (SNES/Genesis)
- Unlimited Saga
- Utawarerumono: Prelude to the Fallen (PS2)
V – 17 games
- Vagrant Story
- Valhalla Knights
- Valhalla Knights 2
- Valhalla Knights: Eldar Saga
- Valkyria Chronicles (PS3)
- Valkyria Chronicles II
- Valkyria Revolution
- Valkyrie Profile
- Valkyrie Profile 2: Silmeria
- Valkyrie Profile: Covenant of the Plume
- Valkyrie Profile: Lenneth
- Vandal Hearts
- Vandal Hearts II
- Vanguard Bandits
- Vay
- Virtual Hydlide
- Virtua Quest
W – 23 games
- Warsong
- Way of the Samurai 3
- Way of the Samurai 4
- What Did I Do To Deserve This, My Lord!?
- White Knight Chronicles
- White Knight Chronicles II
- Wild Arms
- Wild Arms 2
- Wild Arms 3
- Wild Arms 4
- Wild Arms 5
- Wild Arms Alter Code: F
- Wild Arms XF
- Willow
- The Witch and the Hundred Knight
- A Witch’s Tale
- Wizardry: Labyrinth of Lost Souls
- Wizardry: Tale of the Forsaken Land
- The Wizard of Oz: Beyond the Yellow Brick Road
- Wo Long: Fallen Dynasty
- The World Ends with You
- The World Ends With You: Solo Remix
- World of Final Fantasy
X – 9 games
- Xenoblade Chronicles
- Xenoblade Chronicles 2
- Xenoblade Chronicles 3D
- Xenoblade Chronicles X
- Xenogears
- Xenosaga Episode I: Der Wille zur Macht
- Xenosaga Episode II: Jenseits Von Gut Und Bose
- Xenosaga Episode III: Also Sprach Zarathustra
- Xenosaga I & II
Y – 31 games
- Yakuza 0
- Yakuza
- Yakuza 2
- Yakuza 3
- Yakuza 4
- Yakuza 5
- Yakuza 6: The Song of Life
- Yakuza: Dead Souls
- Yggdra Union: We’ll Never Fight Alone
- Yo-Kai Watch
- Yo-kai Watch 2: Bony Spirits/Fleshy Souls
- Ys Book I & II
- Ys I & II Chronicles
- Ys III: Wanderers from Ys (Genesis)
- Ys III: Wanderers from Ys (SNES)
- Ys III: Wanderers from Ys (TurboGrafx)
- Ys V: Lost Kefin, Kingdom of Sand (SNES)
- Ys V: Lost Kefin, Kingdom of Sand (PS2)
- Ys: The Ark of Napishtim
- Ys: Memories of Celceta
- Ys: The Oath in Felghana (PSP/PC)
- Ys Seven
- Ys Strategy
- Ys: The Vanished Omens
- Yu-Gi-Oh! Capsule Monster Coliseum
- Yu-Gi-Oh! GX Tag Force 2
- Yu-Gi-Oh! Reshef of Destruction
- Yu-Gi-Oh! The Duelists of the Roses
- Yu-Gi-Oh! The Falsebound Kingdom
- Yu-Gi-Oh! The Sacred Cards


