In part 1 I went over when games are released, and how that varies by the North American, European, and Japanese regions. What I’m covering in this post is the distribution of games between regions and how long it takes for a game to reach those regions.

Regions Over Time and By System

Almost every console and handheld game once saw a Japanese release, despite having a much smaller population than either North America or Europe, but now fewer and fewer games do. North America and Europe have both seen a consistent rise in the percent of games they receive. There’s a spike of multiregionalism in 2017 that we will see in many of these graphs.

This isn’t a breakdown of how well each system has sold in each region, but it’s pretty close. While Nintendo has seen more games released in North America and Europe than in Japan,  the difference is more extreme for Microsoft systems. The Saturn’s huge number of games released in Japan is the opposite of the Xbox. The PS2 to PS3 is a dramatic shift with around twice the percent of games coming to North America.

Regional Exclusivity

The number of games exclusive to Japan has been dropping pretty steadily for 25 years as fewer games are made there and more of them that do need international sales. The spike in 2020 is probably because many games that will see further releases later just hadn’t been yet at the time I gathered my data. There have never been many European exclusives but they have almost completely disappeared in the last 5 years. 2010 was an odd year with North American exclusives briefly overtaking Japanese exclusives.

We’re not likely to ever see another video game system so focused on one market than the Sega Saturn. The Wii U had a ton of digital games developed by one person or a very small team in America that weren’t able to even release their games in Europe. One region exclusives have largely gone out of style, the Switch, PS4, and Xbox One just having a handful in many regions.

Two Regions, but Not Necessarily Exclusively

I know this is an odd category, but it was easy to do. These are the percent of games released in two regions, and maybe the third. We can see that if a game was released in Japan it has always been almost equally likely to also be released in Europe or North America. But more games overall release in both North America and Europe.

I don’t have a lot to say about this one, all systems have kept roughly the same proportions of each combination, except the Saturn.

Two Regions Exclusively

Games released in North American and Europe but not Japan have risen over time as the Japanese market has shrunk. Although it’s just one more language, compared to the several of Europe, there are some unique challenges to localizing a game for Japan, which has made it less worth it for publishers. Meanwhile few games have ever excluded just North America or just Europe and that number has shrunk over time.

No system has bucked the trend of North America + Europe but not Japan being by far the most common combination of regions.

All Three Regions

It costs a lot of money to release a game in the three major regions, and generally only games with the widest possible appeal get the chance. This has increased over time as digital distribution has reduced some of that cost. Even rarer has been the simultaneous release, which requires a lot of coordination and perhaps sitting on a completed game for some time.

The earliest game I could find with a simultaneous release that I could verify (there’s some spotty and inconsistent information on some earlier DS titles) was Gran Turismo for the PSP on October 1st, 2009. It was even sold physically.

It’s clear here that simultaneous releases were unheard of until the 7th generation, but still rare. In the 8th generation they make up a fair portion of all games. Handhelds have been a bit behind their console counterparts on both three region releases and simultaneous releases.

Regions Charts

Sorry about the wording and coloring being a bit different, but here are the charts covering all of the data seen so far in this post. Not a single PS4 game exclusive to Europe and Japan, and not a single Xbox One game exclusive to North America and Japan.

Region Gaps

Sometimes there is a short amount of time between the release of a game in two regions, and sometimes there is a long amount of time. I am calling the number of days between a release in two regions the “gap”. Games released in only one region have no gap and are not figured into the calculations below, but games released in two regions on the same day have a gap of 0.

These gaps can be for several reasons: a game may not sell well in its initial region, a game has a lot of text, a game may have aspects that are difficult make understandable to a foreign audience, localization teams are busy with other projects, a game may have been made in a way that makes it technically difficult to add support for text that works in different ways and takes a different amount of space, or logistical issues.

The “relative gap” is handy because it also shows us which region gets games first, on average. The difference between positive and negative values is in which region gets a game first. If it takes an equally long amount for a game to reach either region it will stay at 0. This graph shows us that North America has gotten games before Europe on average for every Nintendo system, although it has taken a shorter and shorter amount of time. Games released in Japan used to overwhelmingly be released in Japan before heading to North America and Europe, but this has turned around with the Wii U and Switch.

The “absolute gap”, meanwhile, does not take the first region into account, it is just the total number of days between a release in two regions. Handhelds for some reason have taken longer to leave Japan than console games. Although the 3DS and Switch are handheld neighbors there is a large difference in localization times.

The Playstation has the largest average relative gap with Japanese games taking hundreds of days to reach Europe. Sony’s handheld games have also taken much longer to leave Japan compared to their console counterparts.

The Japanese-European difference only grows in the absolute graph, showing that games released in Europe before Japan take even longer to be localized. Sony’s console games have overall taken a bit longer than Nintendo’s to make the jump to second and third regions.

Despite its overwhelmingly Japan-only library the Saturn’s multi-region games are almost perfectly balanced between how long it takes to reach each region. The Xbox was an outlier for its time, with Japan having to wait on North American and European games instead of the other way around.

Interestingly, the Dreamcast is the only 6th generation console that took longer to release games in other regions than its 5th generation counterpart. The average number of days for a game to reach Japan has stayed very equal between North America and Europe on Microsoft systems.


Here’s the chart for the relative and absolute gaps. The Xbox One wins the award for smallest absolute gap with just 1.77 average days between North American and European releases, no doubt many of them on the same day. Meanwhile Europe to Japan or vice versa took almost a year on average for Playstation games.

I couldn’t resist finding what games took the longest amount of time to cross regional borders for each system. The PS1’s Dragon Ball Z: Ultimate Battle 22 also came up in my metascore study as being responsible for the worst quarter for any system, scoring a 32.03% and being very late in the system’s life. I was surprised that three Pokemon games appeared on this list, as Nintendo was really pushing it hard.

The game that, as far as I can tell, has taken the longest amount of time to be released between two regions is Breath of Fire III for the PSP. 3,820 days after the August 3rd, 2005 Japanese release (physical and digital), North America got a digital-only release on February 9th, 2016. That’s over a decade – the PSVita was about to celebrate its fourth birthday in North America at the time. Europe got a physical and digital release on February 3, 2006, which makes the North America-Europe gap the second longest regional gap.

Sources

Wikipedia’s lists of games by system – for release dates

MobyGames – for release dates


Release dates for games are something we take for granted now, but it didn’t use to be that way. Even big releases generally only had an estimate of what month you might be able to buy them. Super Mario Bros, one of the most important video games ever released, does not have a definitive North American release date

Sonic 2sday, November 24th, 1992, was a promotion by Sega for Sonic the Hedgehog 2 that led to games having set release dates like other media, and less like toys. This was an event to look forward to, rather than different outlets getting a game at different times and maybe not putting it out for sale for a few weeks. This wasn’t quite a worldwide release, with Japan getting Sonic 2 a few days earlier, but a near-simultaneous worldwide release was an impressive and unique feat for the time and was likely the reason games continued to be released predominately on Tuesdays for years to come.

This project looks at the evolving history of video game release dates, starting with the 5th generation – N64/PS1/Saturn/GBC. I didn’t include games from the 4th, Sonic the Hedgehog 2’s generation, because there were still so many games without an exact release date.

To qualify for inclusion games had to have been released in at least the North America, Europe, or Japan region and have at least one known exact release date. I only included consoles and handhelds from Nintendo, Sony, Sega, and Microsoft. The earliest games were Japan-only Sega Saturn games from 1994, and the latest games have announced dates later in 2020.

In total 31,338 games were included with 58,055 release dates.

Date information was mostly from Wikipedia’s lists of games, but several only had the first release date or no dates at all, so I had to manually look up and enter thousands of dates from MobyGames.  I ran many checks on the dates when I was done to find suspicious outliers and made many corrections, but I don’t claim my data to be perfect. My two sources, Wikipedia and MobyGames, also disagree on many release dates and I have no way to confirm which is true.

Sometimes games in Europe are released on slightly different days in different countries. When this was the case I used the United Kingdom’s release date. If there was no known United Kingdom release date I used the earliest known date.

Dates are shown in the mm/dd/yyyy format.

The distribution of Included Games

I’m including these first two graphs to give an idea of the sample sizes involved. 1994 and 1995 were early in the 5th generation and don’t have many games, so averages aren’t very reliable. Most of my data was gathered in early 2020 so there weren’t many games from that year either.

Some systems just didn’t have many games, like the N64, and some, like the GBA, had very spotty information so many games couldn’t be included.

Dates


Here is the average percent of games released in North America on every day of the year. The year on the next several graphs and charts are shown as 2000 because the tools I use won’t accept a date without a year, but it is the average from the full range of years used in the study. The dotted line at 0.27 (1/366*100) represents the frequency we would expect if every date saw an equal number of games released.

There are several outliers but there is a general trend of releases becoming rarer in late November and hitting rock bottom around the end and beginning of the year. Releases pick up slowly but steadily through February and March but then abruptly fall with the start of April. Things are slow but steady until the end of June which sees a surge of releases, before abruptly falling again as July starts. The end of March and June surge may have to do with financial quarters ending. Releases then grow quickly through the end of summer and throughout the fall as holiday shopping picks up, with the biggest release days in November.

Europe follows much of the same trends as North America. February and March see a few more releases, more spread out. There is another end of June surge. The fall flurry is a bit more spread out too, never reaching the same peaks, and ending a bit later.

Japan’s near total lack of releases in the early part of the year is more pronounced than North America’s or Europe’s. Very differently from the other two regions, Japan sees many releases in the last week of every month, but not quite at the very end of them. The middle of the year has fewer releases overall, but not by much.

(I suggest opening these in new tabs) First is the exact percent of games of every date, and second is every date sorted with the total number of games released on that date.

January 4th in Japan is the date with the smallest number of releases, at just one! The game in question was a DSi game known as Trajectile in North America and Reflect Missile in Europe and Japan. Unfortunately, I can’t say for sure it really came out on January 4th, wikipedia says it did, while Nintendo Life says it was the 20th. Regardless, January 4th may get so few releases in part because Japanese workers return from their New Year’s break on this date.

Speaking of Japan, holidays don’t have much of an impact on game releases. Golden Week is a series of 4 holidays on April 29th, May 3rd, May 4th, and ending with Children’s Day on May 5th. But April 29th is pretty average for an end of month date, and early May sees some of the fewest releases. August 15th stood out to me as an unusually light day, but some googling reminded me that this is the day Japan surrendered to the Allied powers, a somber day of mourning those who died in the war.

I was surprised that Halloween is the most common release date in North America, and only slightly less popular in Europe. It’s not a day I associate with buying video games. July 4th, the USA’s Independence Day, is among the least common, and Christmas Eve and Day also see few releases in either region.

North America and Europe have many holidays that can occur on different days of the year, making it difficult to determine if they have any impact.

Days of the Week

Sonic 2sday is sometimes credited as being the reason North American games continue to be released on Tuesdays as well as Tuesday just being the day books, albums, and DVDs come out, so of course video games do too. But is that really true? It wasn’t until 1998 that Tuesday became the most common release day, and it was a pretty small lead until 2003.

If you google when games are released in North America you’ll find plenty of articles and discussions about Tuesdays, but this actually stopped being true a few years ago. Thursdays have taken over and no one seems to have noticed.

Fridays have also seen a surge in releases, while Mondays and especially Sundays have become less popular. Wednesdays have stayed pretty stable.

Europe is pretty similar to North America in terms of dates of the year, but not in terms of days of the week. Friday long dominated releases until the early ’10s, when Tuesday, Wednesday, and Thursday all got a larger share. Saturday, Sunday, and Monday have always had few releases.

This article discusses several factors contributing to the history of Friday game releases in Europe, such as it being the traditional pay day, and to differentiate itself from other media that releases on other days of the week.

Japan, meanwhile, also has its own thing going on. Friday seems to be the big day for the mid 90s (remember that I had very few 1994 dates), but that changed very quickly in 1997 and 1998, instead becoming Thursday. Thursday continued to see most releases for many years, but lost ground in the 10s before reclaiming much of the ground it had lost. I don’t have a lot of 2020 releases for Japan, but it seems like it may have seen another sudden shift, back to Friday.

Tuesdays and Wednesdays have seen a smaller number of releases since 2008, while Saturday, Sunday, and Monday have had very few.

I can’t find any information about why games are released this way in Japan.

Here is a chart showing the exact values for the previous three charts. If we exclude 1994, 1995, and 2020, the lowest value is Sundays in 2018 in Japan, at 0.10%. The highest is Fridays in Japan in 1996 at 92.42% of releases, followed closely by Thursdays in Japan in 2005, at 91.77%.

Days of the Month

I have put the days of the month into 6 groups here because 31 nearly identically sized bars wouldn’t be very enlightening. We don’t hear about what days of the month games come out very often, so I was curious if there would be any interesting trends, and alas, they are almost equal, other than the first part of the month seeing a few less releases.

In the first part of the 25 Years of Games Project, I noted that almost all computer game release dates from the mid to late 90s seemed to be on the last day of the month. I was not sure if those games really did overwhelmingly release on those days, or if the exact date was unknown but every source I could find just said that they did without acknowledging the uncertainty. What I did not notice was a smaller, but still significant, portion of console games with listed dates on the last day of the month too. Looking through them it seems to be more common with N64 and PS1 games than Saturn. I still don’t know if this is a case of a legitimate industry trend, or poor record keeping of the time. 1995 would likely have shown the same bias towards the last day of the month if I had more data from that year.

Europe’s day of month releases look very similar to the North America’s, except that mysterious last day of the month trend is not there. In my findings fewer European releases have exact known dates, so I would expect there to be more uncertainty, more rough estimates, not fewer.

Japan’s major difference from North America and Europe is fewer releases in the beginning of the month, and more at the end, as we saw from the dates dot graph. The difference is still less extreme than day of the week differences, and has seen much less change over time.

Here is every single ungrouped day of the month, with all years combined. The 25th, 26th, 27th, and 28th stand out among Japanese releases. North America and Europe stay pretty similar to each other, with a few exceptions like the 1st, 7th, 18th, 29th, and 31st.

I provide these huge tables so you can find patterns yourself if you really want, and to “show my work” and be transparent about my data.

Months

The distribution of months hasn’t changed much in North America over time. The holiday shopping season of October and November has gotten fewer releases over time. 2019 stands out, with May having more releases than October or November after being one of the slowest months for many years.

Europe is not too different from North America in terms of months of releases. 1999 was quite an odd year with over half of all games releasing in October or later.

Japanese releases are more spread out through the year, with a small bump at the end of the year. January and May have few releases in all regions.

Here is the overall month distribution of each region. I didn’t mark it but 8.33% is where the these bars would be if every month had an equal number of games. I’m not sure why March is so popular. It may get some games that were intended for September-November but got delayed, or maybe there is just a need to get games out before the slow spring and summer season. Japan has quite a large drop from December to January.

This is all of the month data. January 2000 in Europe was the slowest month in the years included in the study, just 1% of the games that year. On the other side of the spectrum, in North America one fourth of the releases in 1998 were during October.

That is all of the detailed date data I have for you. With this data set I was also able to learn a lot about how many games are released in different combinations of regions, and how long it takes for games to release outside of their home region, so please come back next month for part 2.


Sources

Wikipedia’s lists of games by system – for release dates

MobyGames – for release dates

Sonic the Hedgehog 2 – information about Sonic 2sday

Happy Sonic 2sday (almost) – more information about Sonic 2sday

Al Nilsen – former Sega employee for the Sonic 2sday sticker image


This was originally posted on reddit and I was overwhelmed with the response. So overwhelmed that I decided I wanted to do a lot more of this kind of thing. Please keep in mind that this was written in mid 2019. This post has been slightly edited.

One day I found myself wondering just how many Japanese exclusives there are and where games are being made and how it has changed over time. I really wanted to know, but I couldn’t find anything substantial. I started this project in November, 2018 and that is the cutoff, any games released after that date are not included. I made a collection of spreadsheets with every game, system, country(ies) of origin, developer(s), publisher(s), and release status among North America, Europe, and Japan. I used this data to create charts and infographics to answer my questions and look into video game history.

I stuck to Nintendo because they have a long history in games and I know them well. Even if you’re not into Nintendo, I think there is a lot of interesting information about the industry here and how it has changed since the 80s.

I know 15,000 is a suspiciously round number, but I didn’t plan it that way. After I pasted wikipedia’s lists into my spreadsheets, and added some games I found missing, it was about 15,035. I got rid of some stuff that didn’t belong, detailed below, and ended up with exactly 15,000.

What is included:
  • All officially licensed and released games on consoles and handhelds by Nintendo.

  • 64DD

  • Virtual Boy

  • Famicom Disk Drive

  • Digital-only titles, DSiWare, WiiWare

What is not included:
  • Virtual Console titles. These I considered the same thing as the original.

  • Satellaview. Many games have very incomplete information, and it’s not always clear if a game is “different enough” from its original SNES version to be considered a different game.

  • Non-games software. So no Game Boy Advance Video, Hulu app, or system settings. This also includes a few oddities like a sweater design program or 8 keys you can press to make music. I was very broad minded about this one, for example a study guide for taking a learner’s permit test for the DS said it had mini games, so I included it.

  • Games that didn’t release in North America, Europe, or Japan. There were fewer than 10 of these, but I did uncover a Hello Kitty and Bomberman game exclusive to South Korea, and some rugby/soccer and singing games exclusive to Australia. If I were to include them, I’d need release information for South Korea and Australia on every other game, and that information does not seem to exist.

  • Philips CD-i

  • Game & Watch and other miscellaneous electronic Nintendo gadgets.

Some Important Details

There are some important things to note about how I structured this data. I combined development studios and publishing companies that were owned by another company into one. For example, Ubisoft Paris and Ubisoft Barcelona are both Ubisoft studios, so they both just count as “Ubisoft”. Ubisoft bought Red Storm Entertainment in 2000, so it counts as Red Storm Entertainment before they were bought, and as Ubisoft after. Sometimes video game companies are bought by non-video game companies, I ignored these unless that company also owned at least one other video game company. For example, Atlus was bought by Index, which also owned Interchannel, so those companies were counted as Index. I counted a company as owned by another if they owned more than 50% of it, so D3 Publisher counts as Bandai Namco from the date that they acquired most of their stock.

Merged companies I counted as a new company. So Squaresoft and Enix are counted separately from Square Enix.

If a company changed their name, I used the most recent.

When games were ported, I credited the porting studio, whether that was the original creator or not. I found quite a few Switch games were handled by porting companies, but there are probably some that I missed on other systems because wikipedia is inconsistent about who gets credit.

Because of all this, some titles are credited to companies that might seem odd.

I wanted to get some stats about second parties, but that is a bit more complicated than it may seem. If you look for a list of Nintendo second parties, you will see different companies included and the likes of Intelligent Systems, Next Level Games, and HAL Laboratory. Developers that often or exclusively work with Nintendo. But most of these companies are not owned by Nintendo. Only four external studios are owned by Nintendo: Retro, 1-up, Monolith, and NDcube. I did actually make special note of these companies, they released 50 games total, on about half of Nintendo’s systems. This was pretty minor and not very interesting so I didn’t give them special sections in anything.

Sometimes companies were bought and sold and merged and went independent several times. Researching all of this took a lot of time. Have a quick look at the many Atari pages on wikipedia if you’d like to see how fun it was. I have about 10 pages of notes about company name changes and ownership.

There were also many cases of different sites having different information. On one occasion I found 5 unique developer and publisher combinations listed for a game on 5 different sites.

Some games (mainly tie ins and other very cheap stuff) will have a very obvious publisher that you can find anywhere, but the developer is unlisted. I did my best here, researching hundreds of games to try to find the company that made them. When I couldn’t find anything I credited the publisher as being the developer, which will be true in some cases and not in others. Konami and Bandai Namco seem especially likely to not credit development companies. Many of these are probably done by low profile and often anonymous outsourcing companies. You can read more about these companies here and here.

The Charts

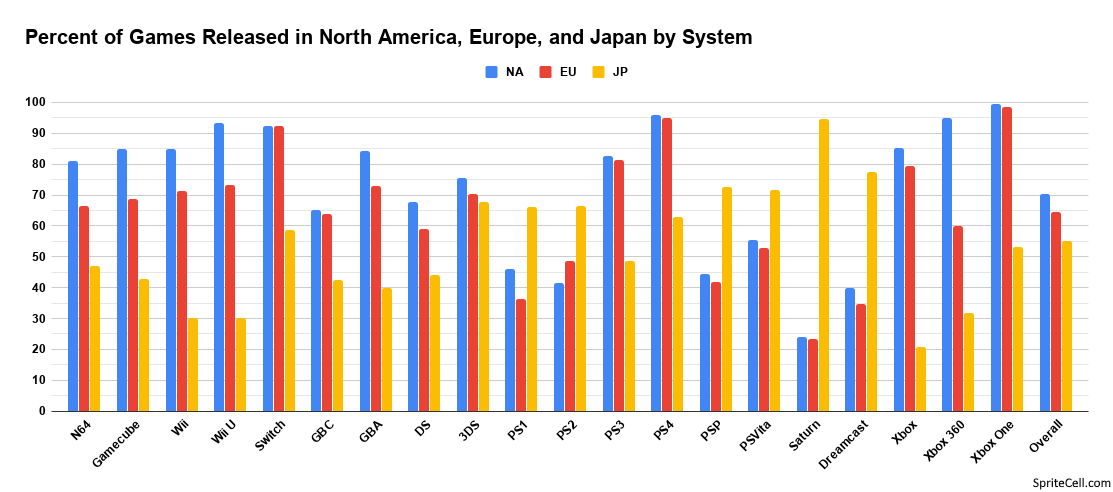
First I’ll go through system by system, and then some charts detailing the overall progression of various things over time.

System Charts

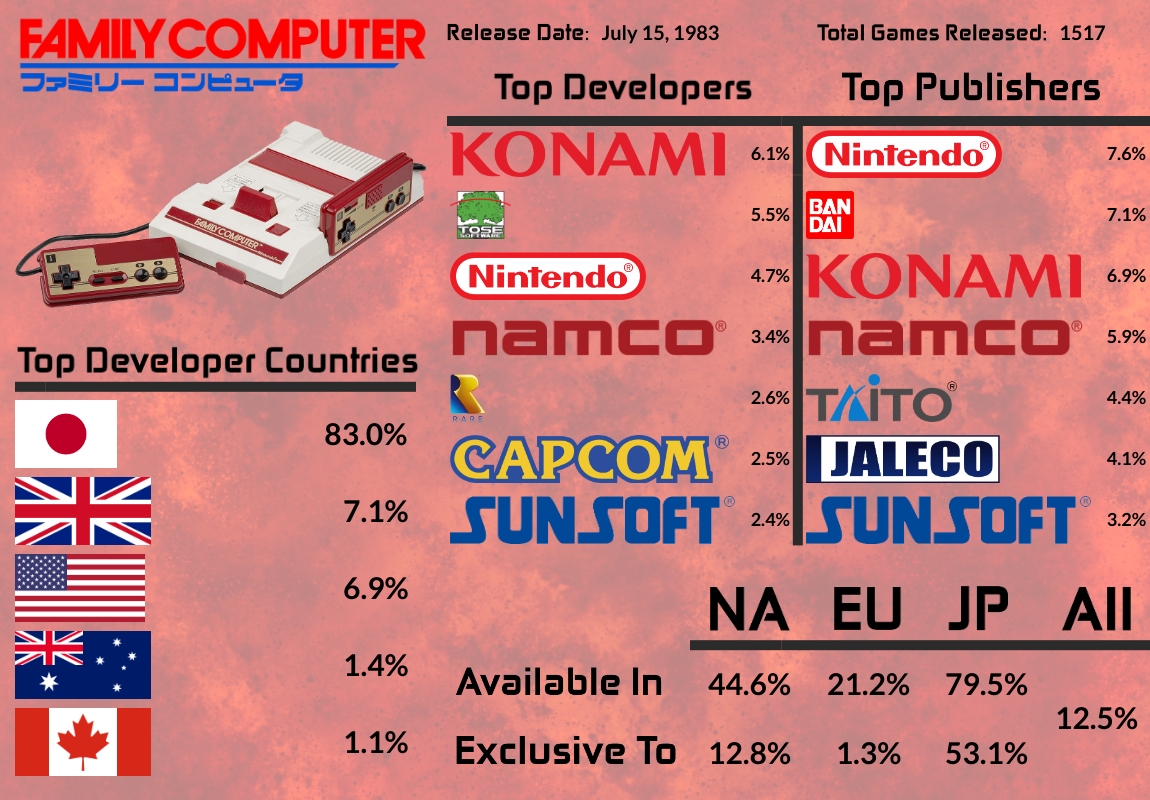
This includes the Famicom, Famicom Disk System, and NES. Wikipedia lists them separately so I had to combine games when they were ported overseas. We can see right away that Japan dominates releases here in the 80s. Eight of the nine companies that developers or published the most games are Japanese, and most of them are still around! Most games were released in Japan and a majority were exclusive.

Nintendo’s next piece of hardware was the Game Boy. Not quite as Japan-dominated as their home console. That 7th developer is Graphic Research. Given its long life and how cheap it was to make games for, you might have expected more than 1053 games.

1751 games, a figure that would not be surpassed until digital distribution. If you’re not familiar with TOSE, here’s a quote from their wikipedia page:

“We’re always behind the scenes,” said Masa Agarida, Vice President of Tose’s U.S. division. “Our policy is not to have a vision. Instead, we follow our customers’ visions. Most of the time we refuse to put our name on the games, not even staff names.”

Many of the games they are now credited with weren’t known at release. There’s a whole wiki dedicated to finding the developers of games. That 7th developer is Telenet Japan. This is the system with the highest percentage of games available in Japan, other than the Virtual Boy.

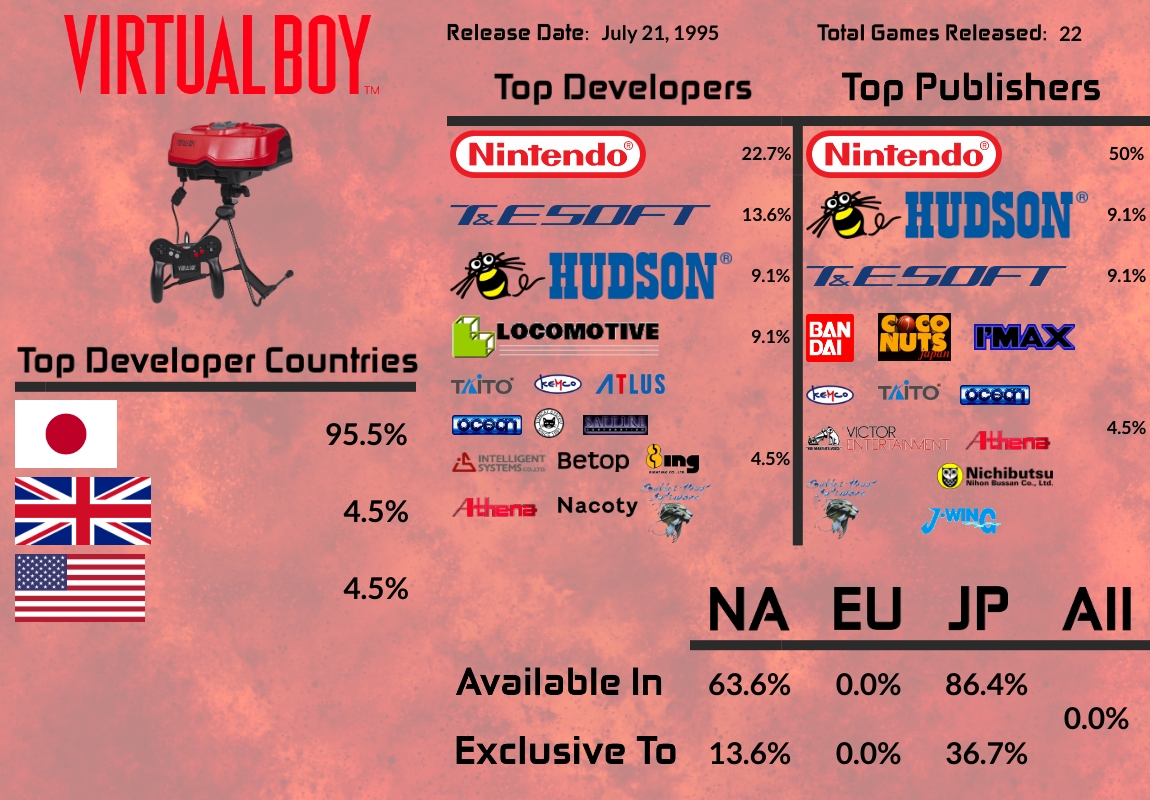
And speaking of the Virtual Boy, here it is, the holder of many distinctions. Two of the developers, Betop and Nacoty were so obscure they have no known logos. Probably the only video game system in the world to boast more than 18% of its library consisting of bowling or Tetris games.

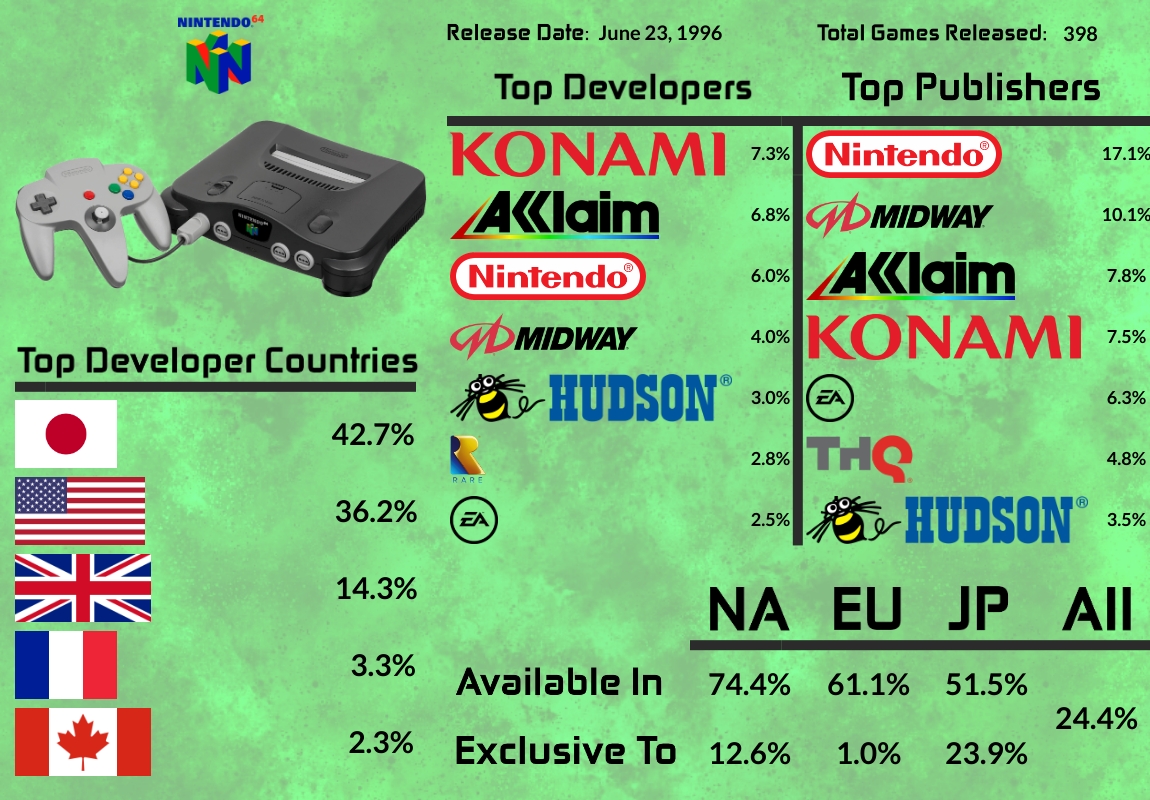
Other than the Virtual Boy, the N64 had a publisher controlling the highest percentage of the catalog. It’s tough when your third party support vanishes so quickly. Also other than the Virtual Boy, the smallest number of games released on a Nintendo system. Few systems are as synonymous with a single developer as the N64 is with Rare, which managed to create the 6th most games for the system, all of them pretty well regarded upon release. We see a big uptick in the percent of games released in North America here, a trend that would continue with consoles. A big drop in the percent of games developed in Japan, too.

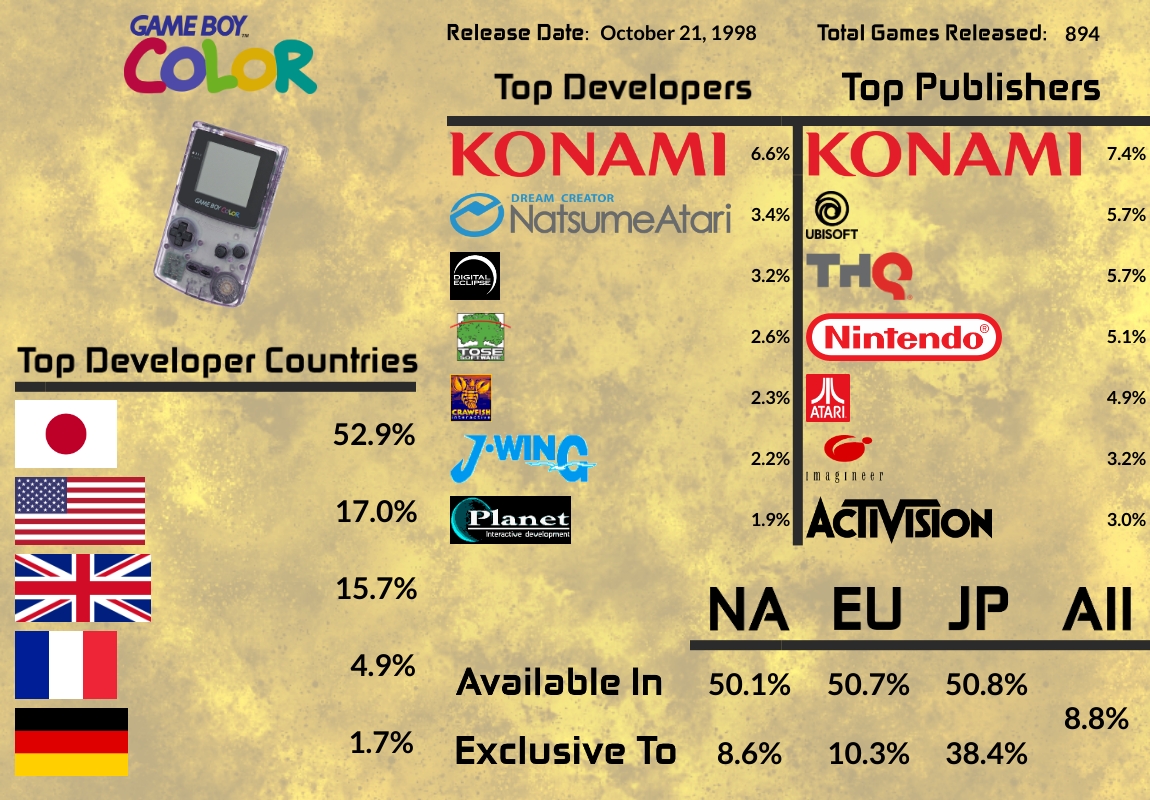
Quite a few games were released on the Game Boy Color, even though its successor was not far away. Many of these were ports of Game Boy titles, however. Nintendo made fewer games for the GBC than any other system except the Virtual Boy. The top developers is odd mix with several companies that we won’t see in the top 7 again. Please note that the Atari in the publishers is Atari, SA, which was at the time known as Infogrames. An incredibly even distribution of games available in each region, yet so few available in all.

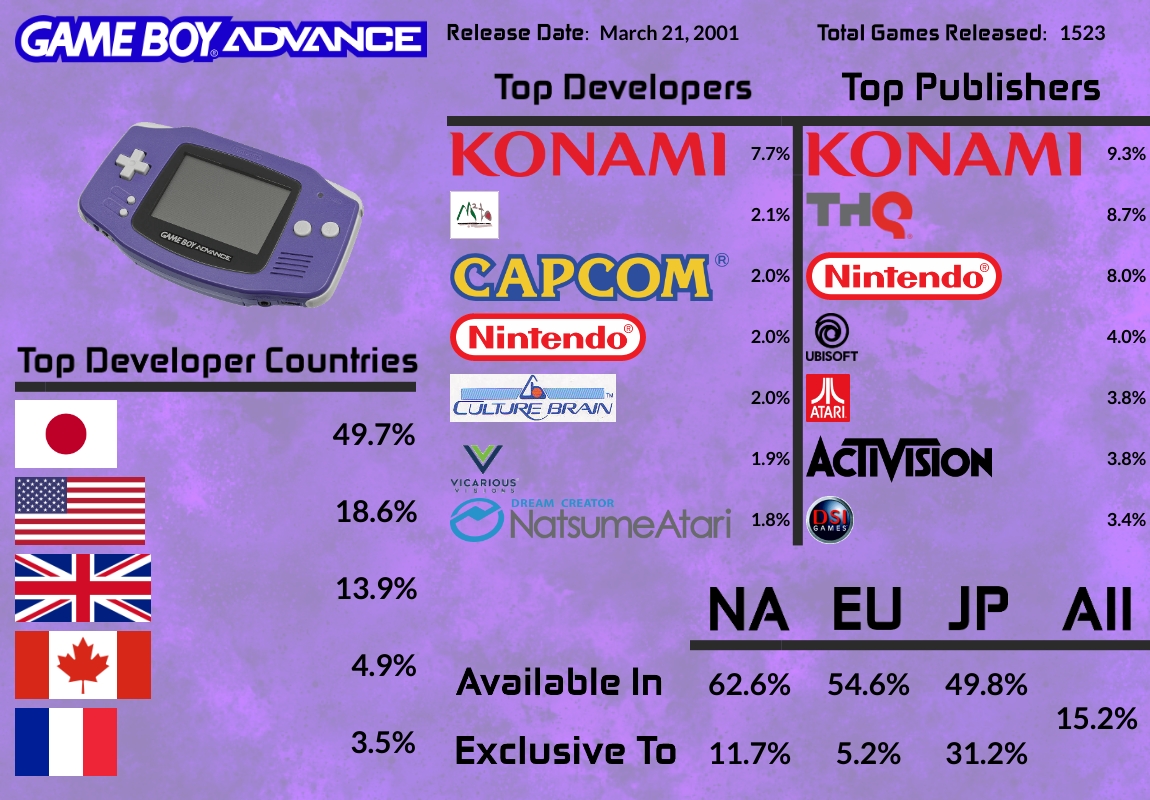
The Game Boy Advance saw a flood of cheap tie in games. This is also towards the end of the era where even many small budget games would get separate versions released on handhelds, made by different developers. It’s very likely that many of those Konami games were not developed by them, but by third parties who did not want to be credited.

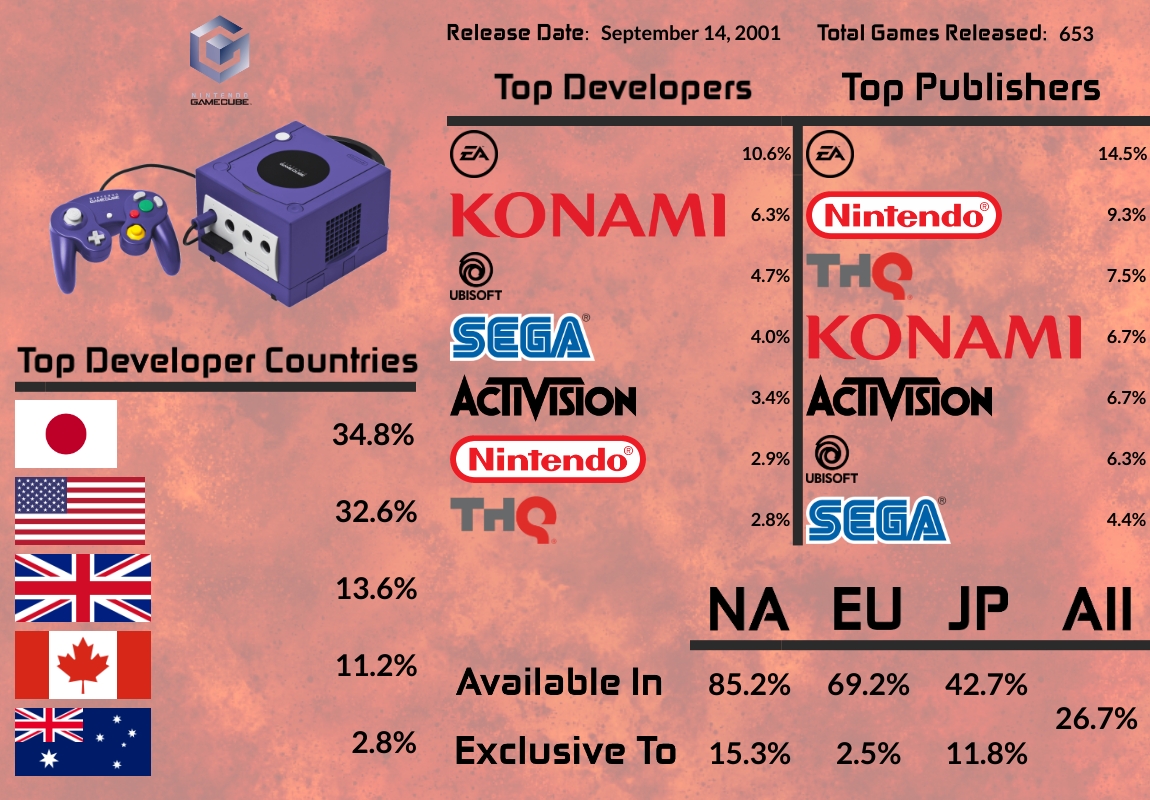
I was pretty shocked by how many Electronic Arts games there were on Gamecube. Several yearly sports titles all hit the Gamecube while Japan largely avoided the console. Over 85% of the library was available in North America, a new high for a region (excluding the Virtual Boy). Despite their last console coming out during the same generation as the Gamecube, Sega managed to make a substantial portion of its library.

Still the Nintendo system with the most titles, the DS was a phenomenon that became the second-best selling video game system. There was a big jump here in the number of countries that developed games. Nintendo developed 65 games for the system, second only to the NES/Famicom’s 72.

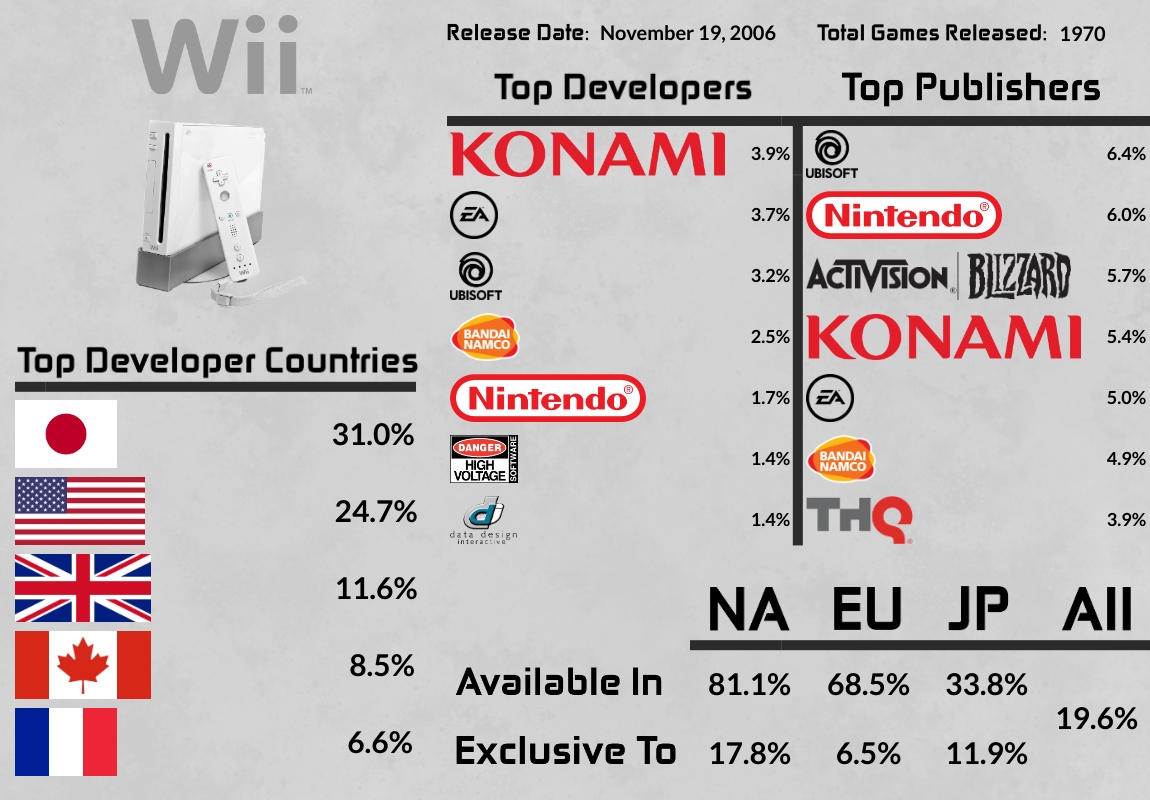
Japan’s lowest share of game development yet, with a lot of North American support. Like the DS, there were a lot of new or new-to-Nintendo developers for the Wii, trying to catch the zeitgeist. Unfortunately, a lot of these titles were shovelware. High Voltage Software and Data Design Interactive don’t come close to this level of output again.

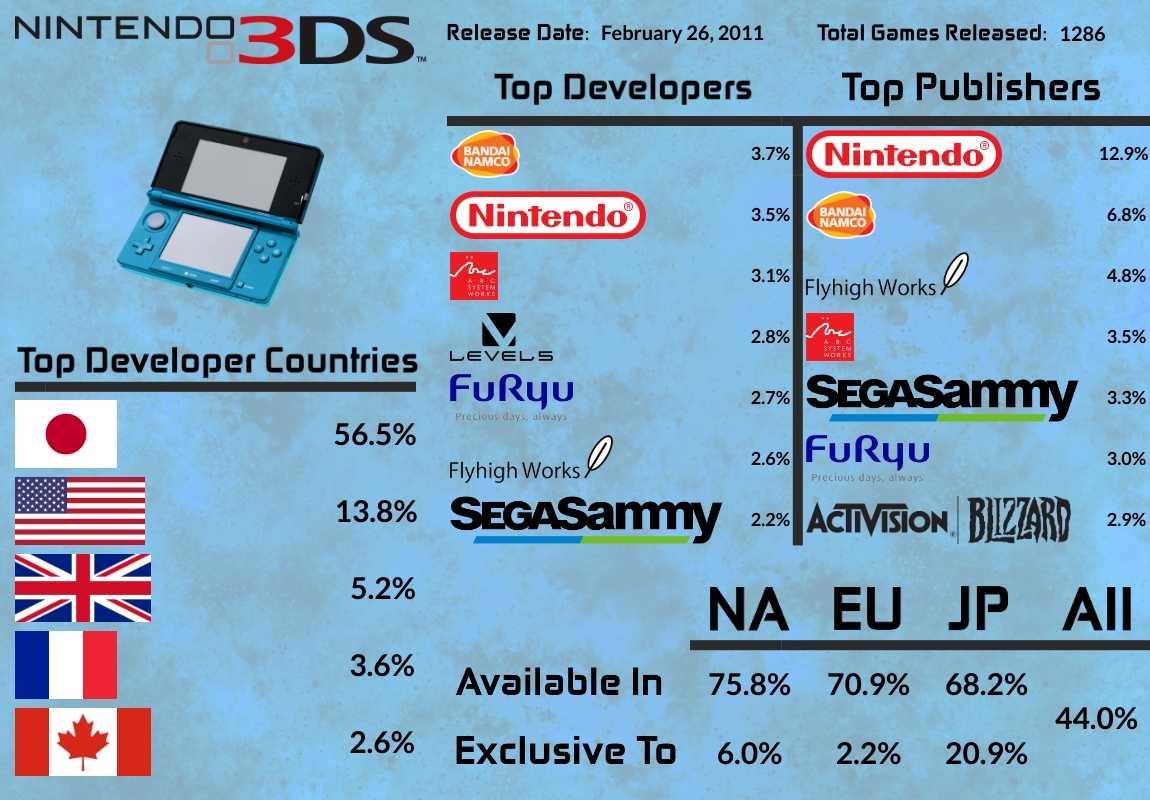
The 3DS bucks the trends and has a lot more Japanese support. One of the things I wanted to look into was the Japanese preference for handhelds and here we can see the difference it makes. Despite this, we see a lot more titles released in all regions than ever before. Four companies make their first appearance in a top 7, all Japanese.

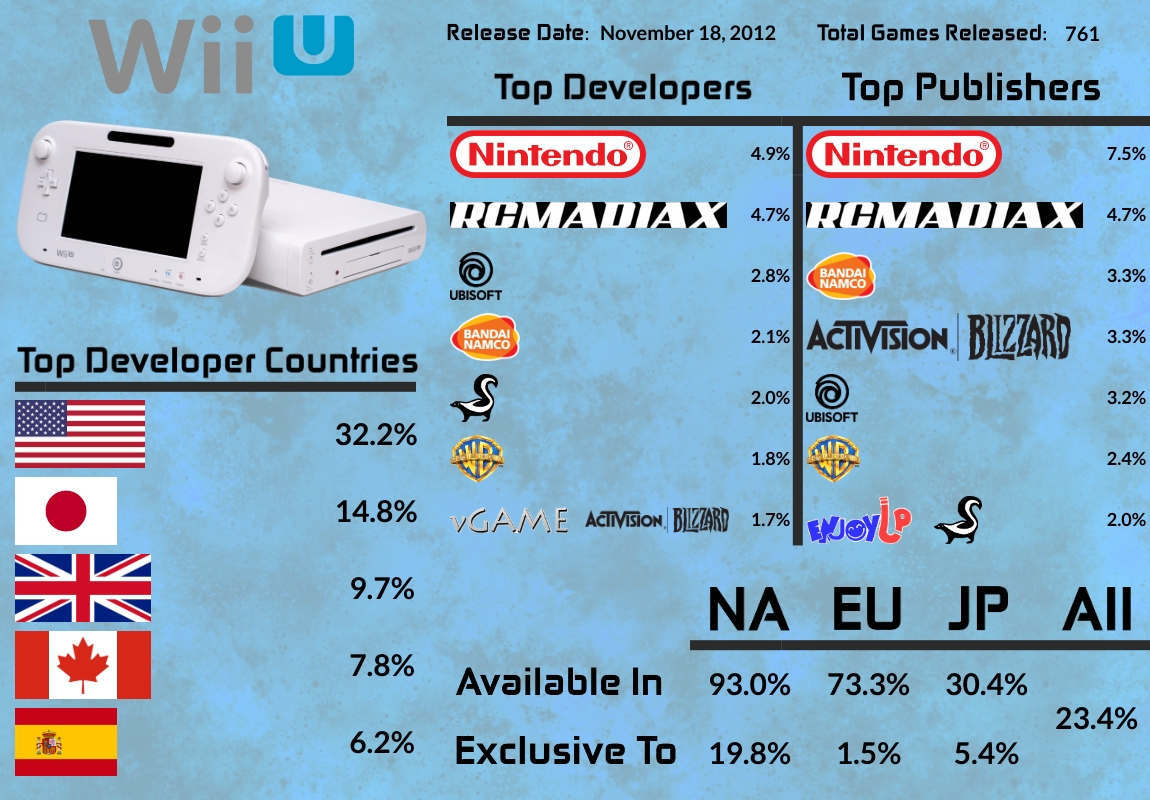
The U.S. takes first place in development for the first and only time with the Wii U. That was largely because of RCMADIAX, who was second in development and publishing output. RCMADIAX was a one man operation that flooded the eShop with cheap, barebones games. He submitted a game for approval on the Switch but was denied and left the video game industry shortly afterward. Skunk Software was also a one-man operation. At 8.41% the Wii U had my highest unknown country of origin. There were quite a few tiny indies that never even had a website and only existed for a couple years.

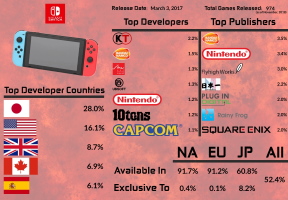
Keep in mind that the Switch has several years left so its library will change, but here is where we stood in November, 2018. At roughly 1000 games every two years, the Switch should eclipse the DS in number of games eventually. You may notice that the top developers and publishers have lower percents than usual. There are tons of new studios that are making Switch games, so it’s very spread out. I had to do the most research for this system because there were so many errors on the wikipedia list. Spain is so high here because there are a lot of Spanish porting studios and lots of those medium to large indie games seem to outsource their Switch ports. We also see an unprecedented surge in all-territory releases, with very few region exclusives. Despite combining their console and handheld teams, Nintendo has thus far developed and published a smaller percent of the Switch library than any of their other systems, largely because of the huge number of titles being released.

Overall Charts


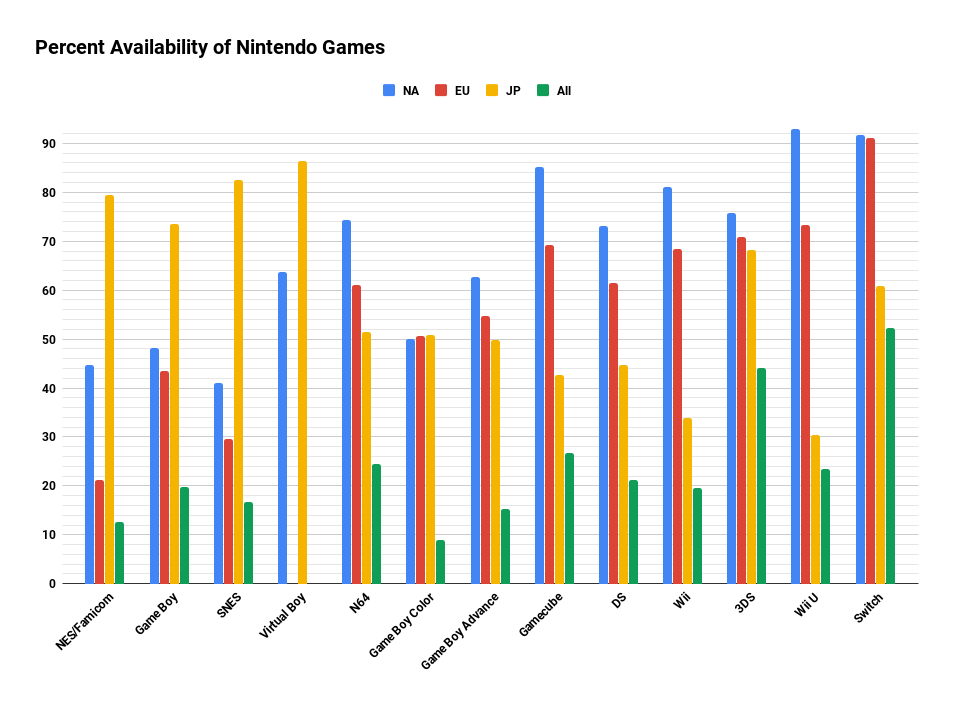
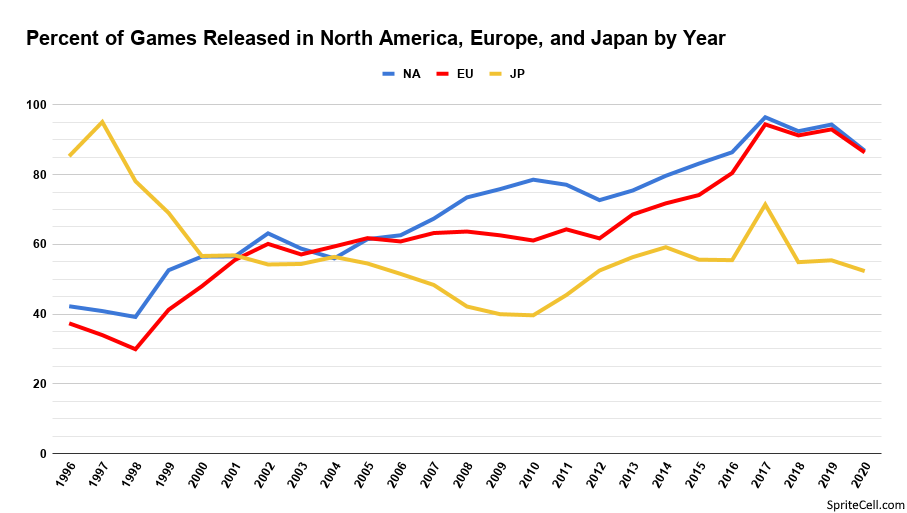
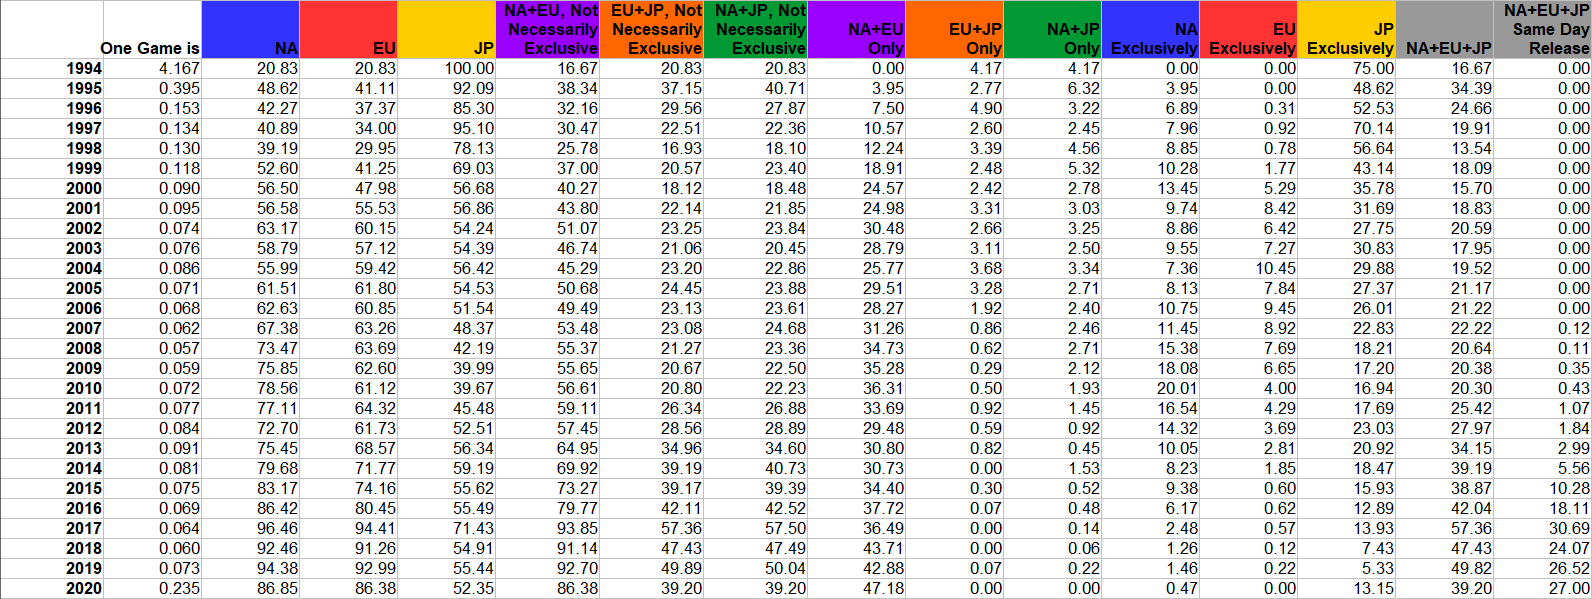
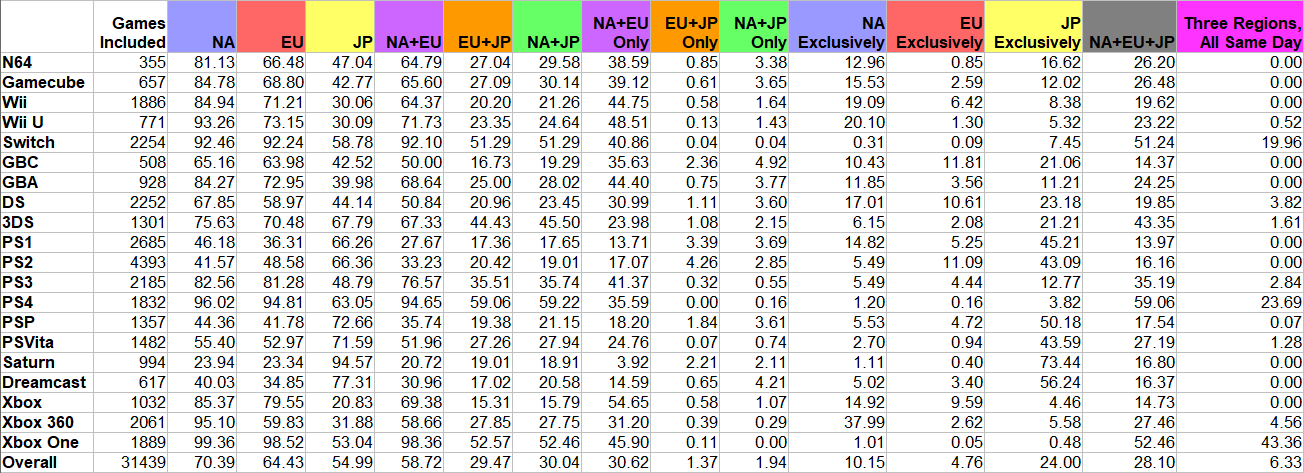
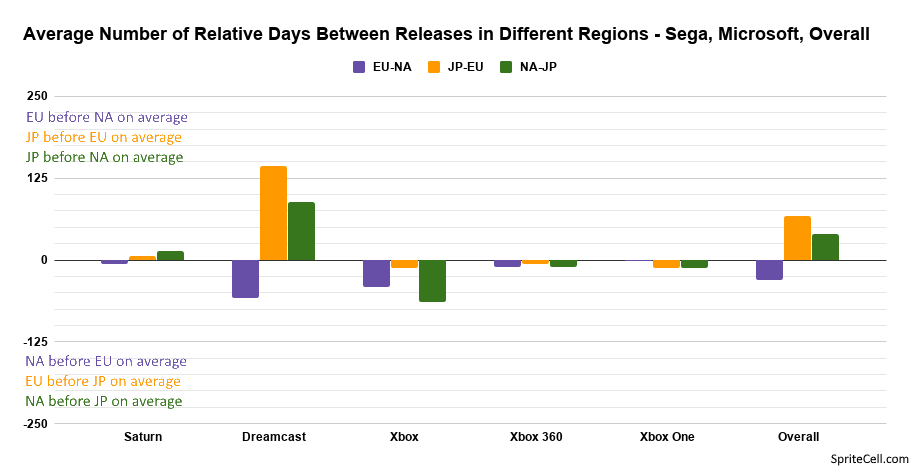
We can see that more games have been coming to more regions over time, although a varying number of games have reached Japan.

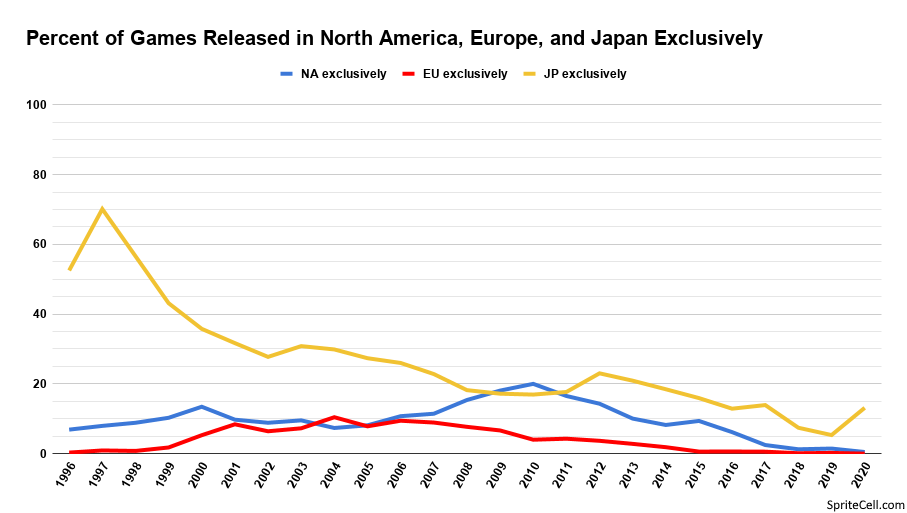
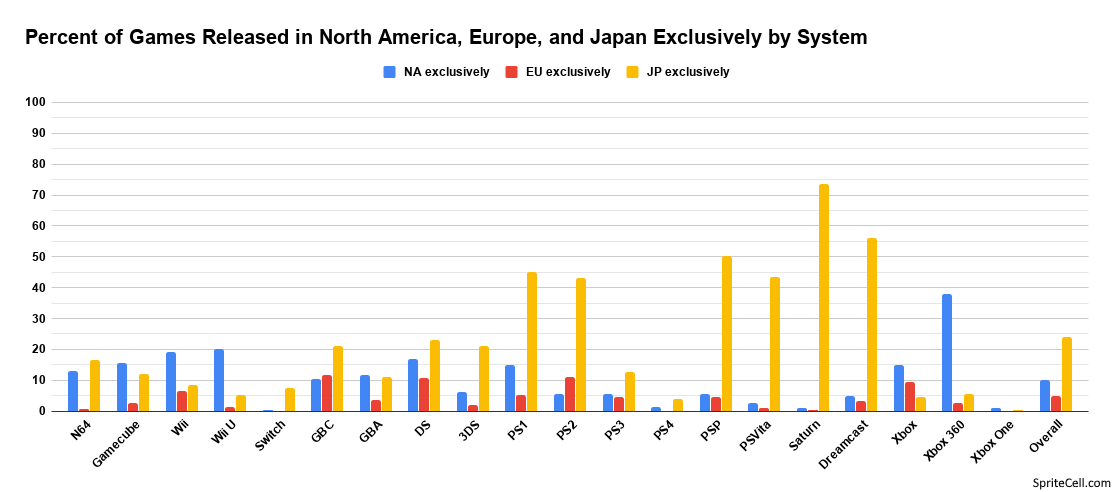
While Japan had a large chunk of the exclusives in the early days, that number has fallen greatly. Europe has never had many exclusives.

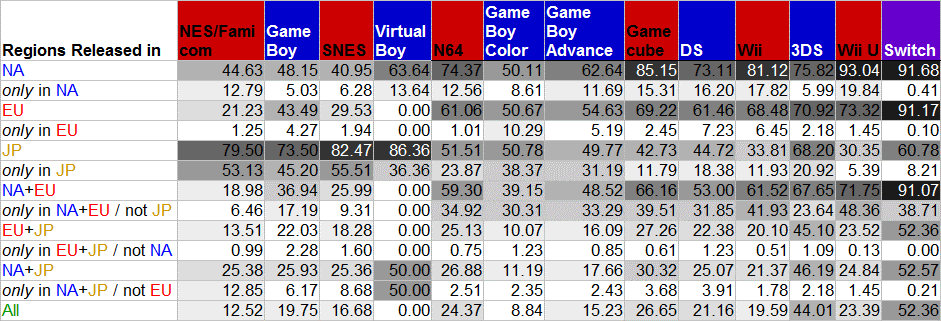
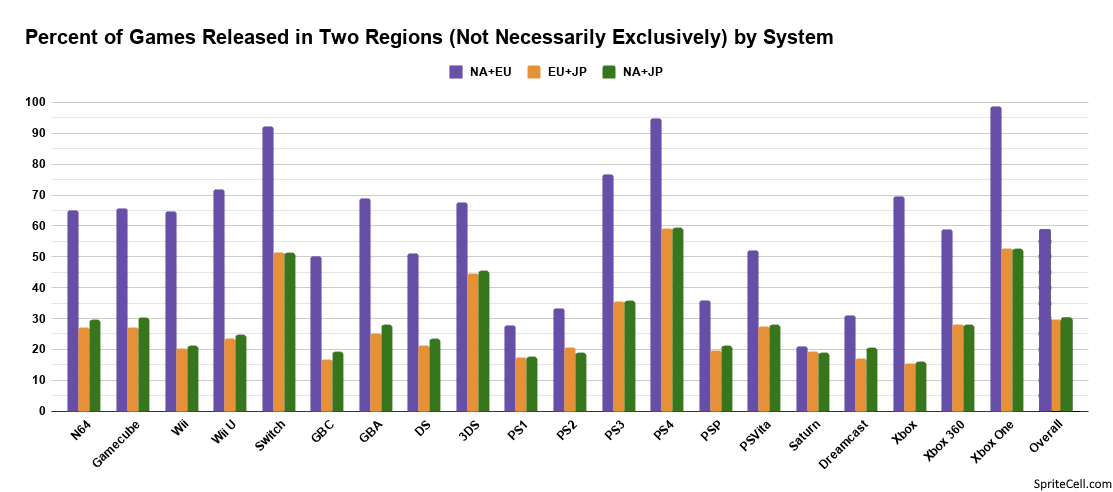
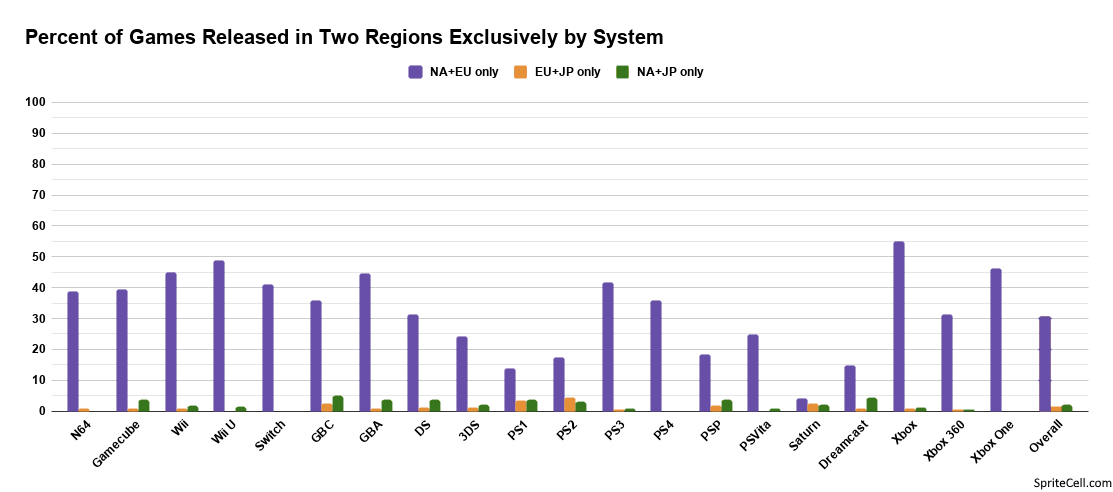
Here’s a chart with all of the available in and exclusive to numbers, but also with combinations of two regions. Japan and Europe exclusives are mostly soccer/football games.

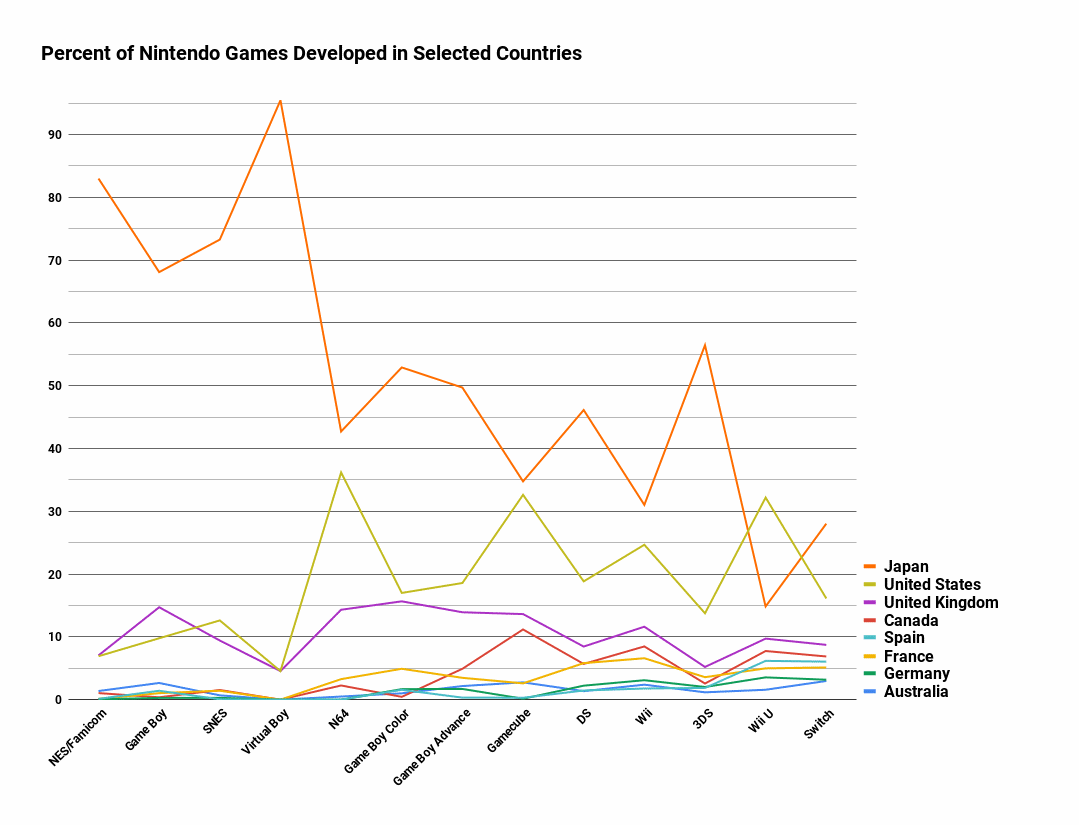
These are the top 8 countries that have developed the most games. Every console has seen Japan’s relative output drop, though they have rallied a bit with every handheld, while it’s mostly the opposite with the United States. Gamecube’s Canada spike was because of EA Vancouver’s sports titles. From the Wii forward Europe and Australia seem to go up and down together.


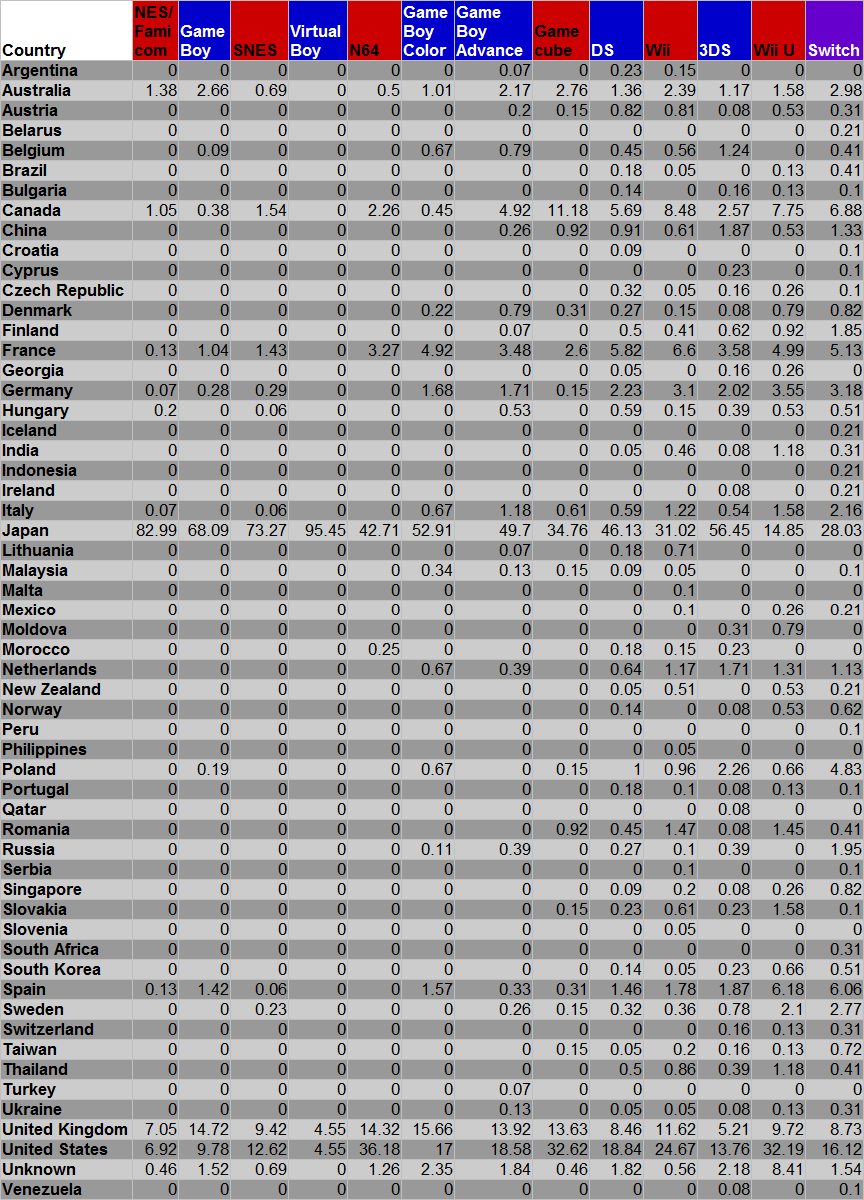
Here’s a chart with every country’s percentage of games and a map of every system put together. As you can see most countries represented only worked on a handful of games, while Japan, the United States, the United Kingdom, and a few Western European countries made the bulk of games. I’d say the Game Boy Advance was the start of more countries getting involved in development.

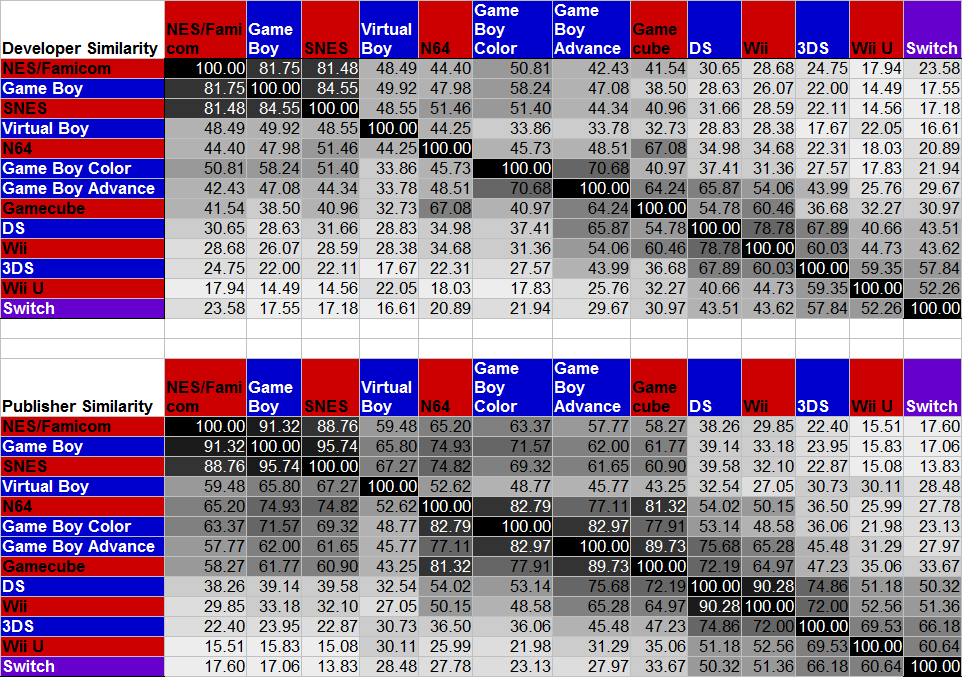
I wanted to measure how similar the group of developers/publishers were from system to system. For instance, maybe a lot of developers were only interested in the handhelds, or maybe publishers would only touch systems that were market leaders. This is a difficult thing to measure, but I gave it a try. Please consider the results as experimental and potentially inaccurate as I am not sure my methods were sufficient. The numbers are not percents, but more like “scores” where the maximum (the exact same developers/publishers in the exact same proportions) is 100. Mostly we see that systems are most similar to systems released close in time to them, which makes sense but is not very enlightening.

I listed the top 7 of each system, but here are the top 25 overall, by number instead of percent this time. Konami’s lead will erode over time, but it will take a few generations with how long it takes to make games nowadays. TOSE is not a well-known name, but it probably worked on a fair number of games they weren’t credited for. Bandai Namco could take both second places if you add their pre-merger companies together. Sunsoft largely left video games by 2001, yet still makes both lists.

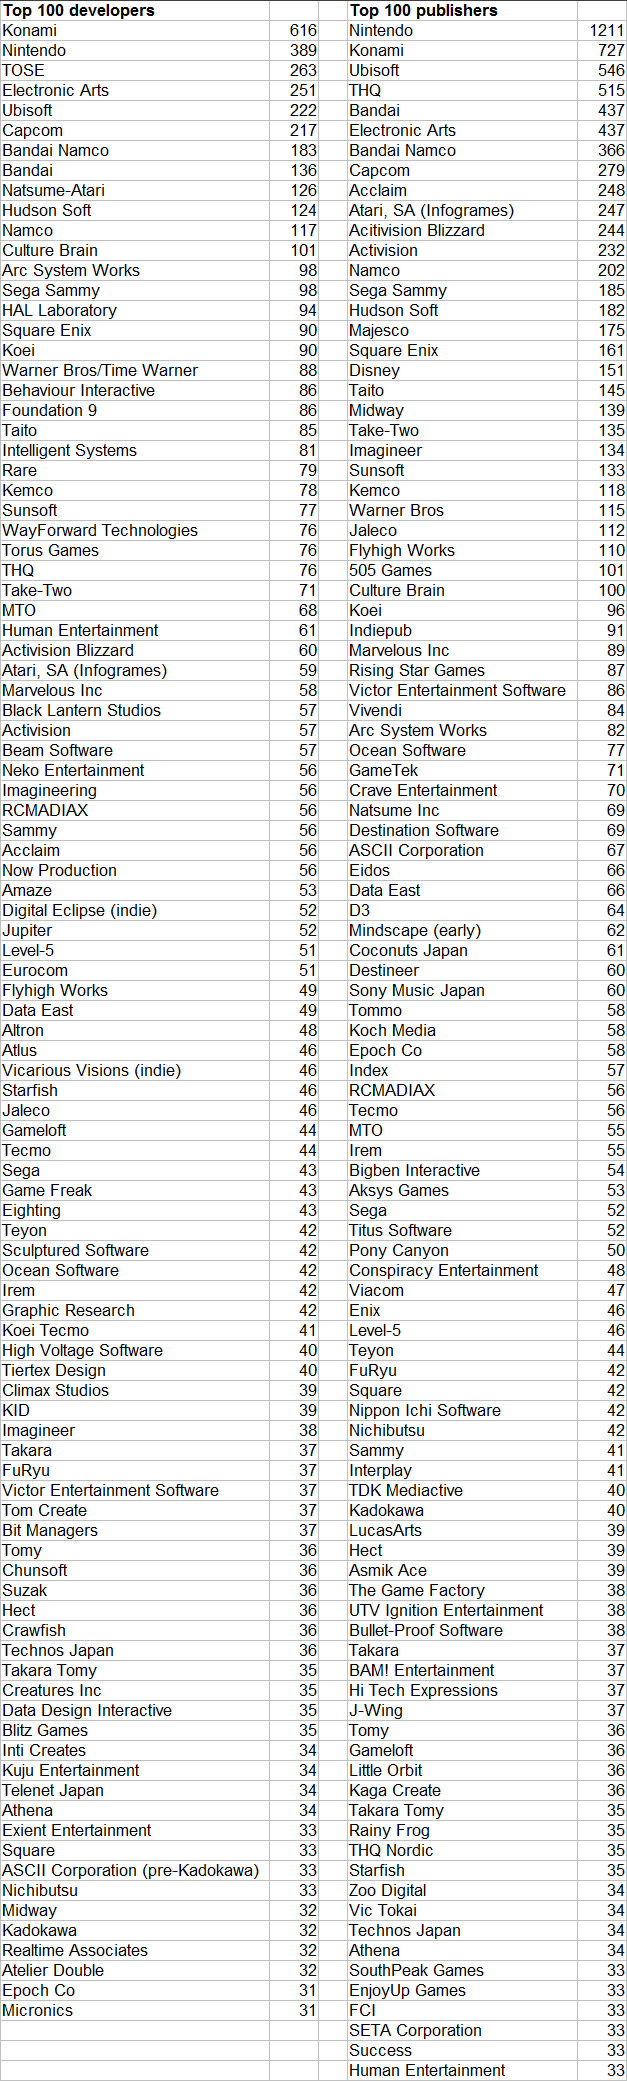
In case you wanted an even bigger list, here are the top 100. Please remember that because of the way I combined companies that some of these names will be strange. To hammer home how much cheap junk RCMADIAX pumped out, they hit the top 50 despite being active only during the Wii U.


Here are the developers that released at least one game for at least 10 systems. This time I did combine companies before they merged with their merged company. Lot of absences for the Virtual Boy, of course. Intelligent Systems will make its Switch debut very soon with Fire Emblem: Three Houses and become the only second/third party to support every Nintendo system. Kemco had a rare Virtual Boy title, but skipped the DS of all things. Konami only released Virtual Console titles for the Wii U, yet had a launch title ready for the Switch. Square had a bit of a falling out with Nintendo over the move of Final Fantasy 7 to the Playstation, which kept them away for a time, but they eventually made up.

And here are the publishers that have supported at least 10 systems. Square Enix let Nintendo publish Final Fantasy Crystal Chronicles, which keeps them from the “everything but Virtual Boy” club. Ubisoft, Electronic Arts, and Take-Two weren’t always huge publishers, but they have been releasing games on Nintendo systems for a long time.

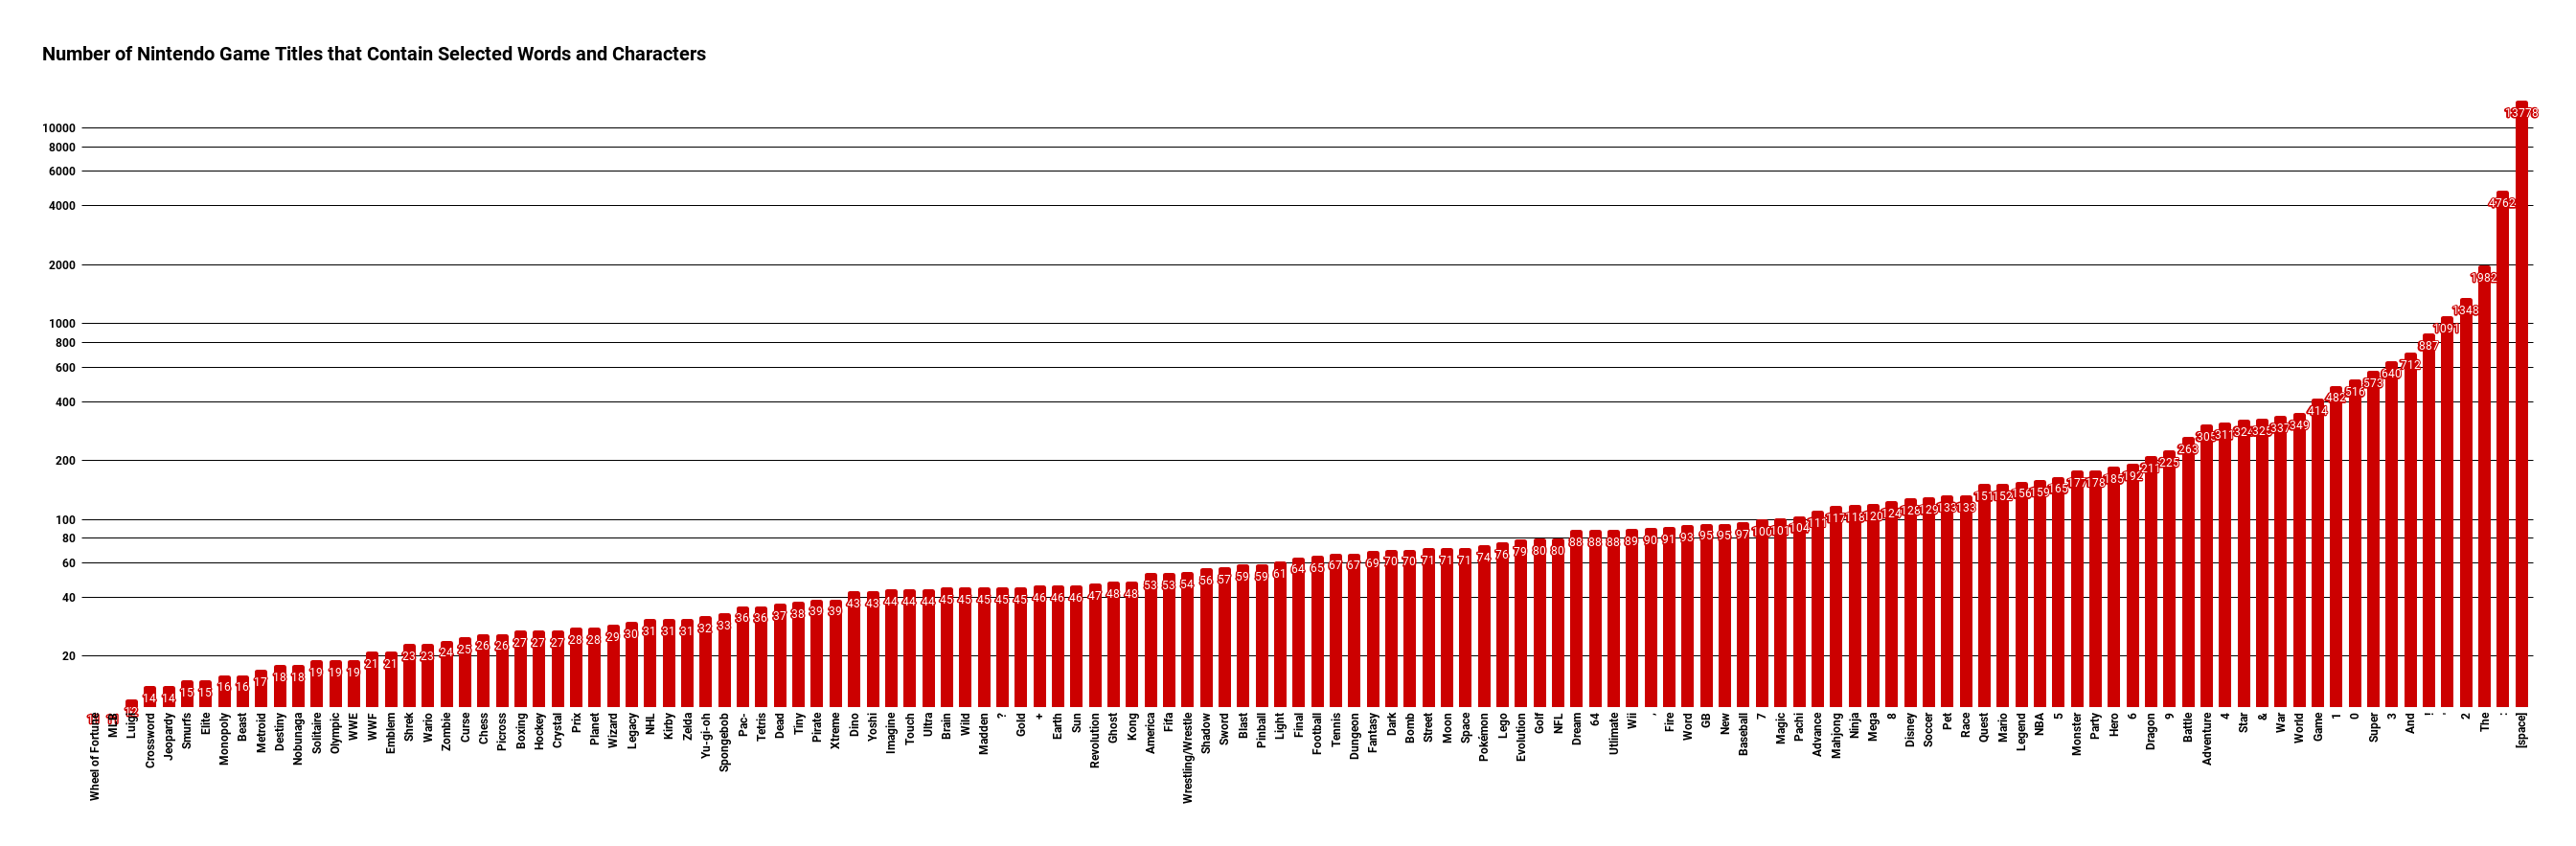
Have you ever wondered how popular it was to put “64” in the title of N64 games? More than a fifth of them did. Seven is the least common digit in titles. Almost every game title is made up of at least two words (this is a count of titles in which a text string occurs, not a total count).

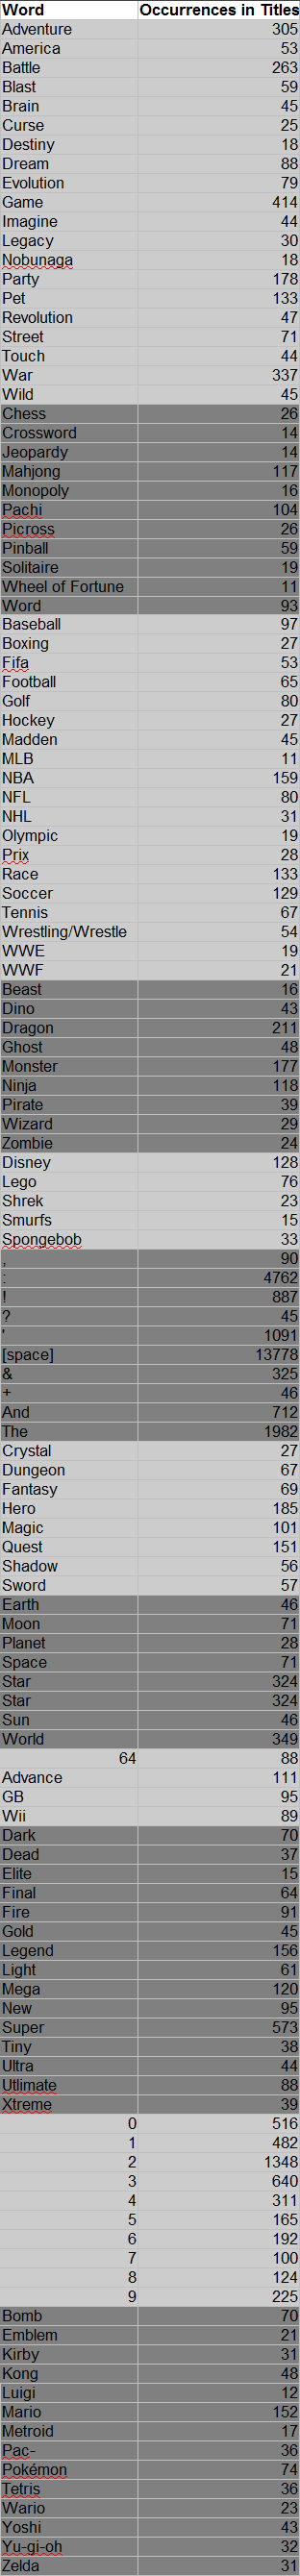
Here’s the same data grouped into themes and maybe a bit easier to read.

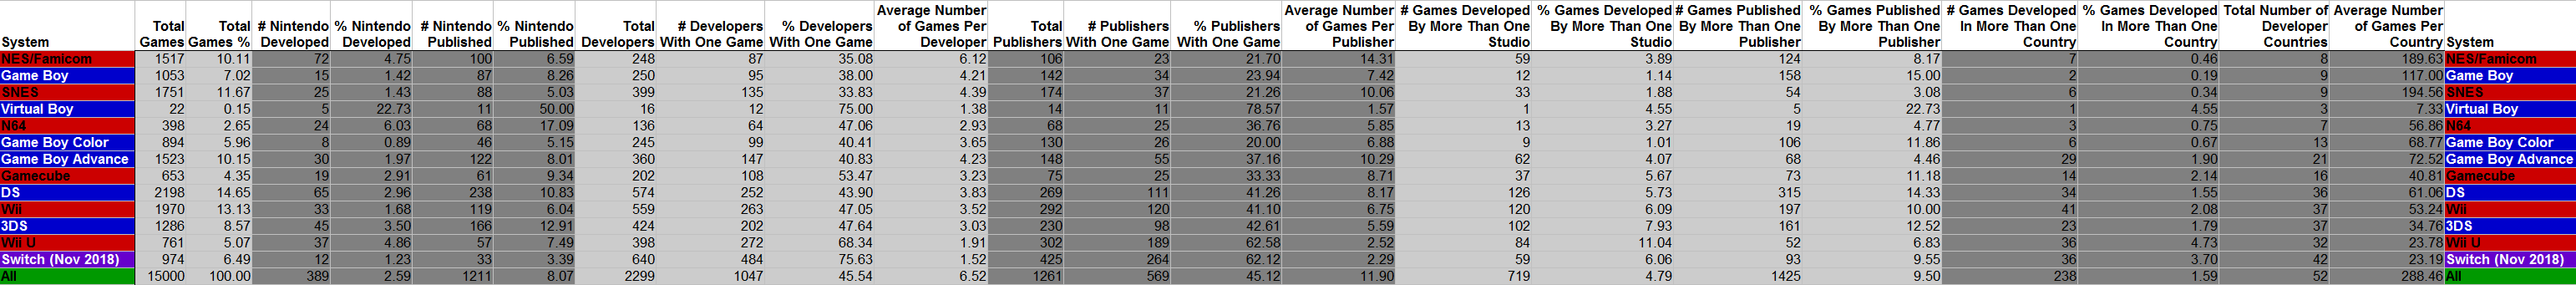
And finally, some miscellaneous data, like how many developers/publishers only released one game on a system, and how many games were developed by more than studio, published by more than one company, and made in more than one country. Here we see that collaborations between studios, including studios in different countries has increased over time.

Other Facts I Came Across

  • From Ubisoft Montreal’s wikipedia page: “The studio as of 2017 employs more than 3,500 staff, making it one of the largest game development studios in the world.”

  • I recorded numbers for Hong Kong separate from China, but didn’t end up using them. There were 33 games developed in Hong Kong, and 50 elsewhere in China.

  • Similarly for the UK: England 1474, Scotland 74, Wales 18, Northern Ireland 1.

  • Just Dance 2014 for the Wii and Yo-kai Watch Dance: Just Dance Special Version for Wii U both had 7 development teams listed, although these vary a bit by source.

  • The shortest game title was X for Game Boy.

  • The longest game title, which I cannot confirm is accurate, is a 3 in 1 game collection: Kunio-kun Nekketsu Collection 3 Downtown Special: Kunio-kun no Jidaigeki da yo – Zenin Shūgō! Ike Ike! Nekketsu Hockey-bu: Subete Koronde Dairantō.

  • The total developer count was 2299 when combining studios owned by companies. However, the way I structured things included these subsidiary studios separately. There were 2547 developers including them (plus a few tiny ones that I lumped together).

  • Atlus was owned by Takara (7 games), Sega Sammy (12 games), Index (17 games), and was independent (46 games) which would have been good enough for 22nd most prolific developer if combined.

  • I have 14 THQ-owned, 15 Take-Two-owned, 23 Electronic Arts-owned, and 24 Ubisoft-owned developers recorded.

  • I noticed some recurring themes in developer names. The following are the number of studios with a given string in their name. 21: 3, Infinite: 5, Planet: 5, Silicon: 6, Ninja: 8, Black: 12, Dream: 14, Pixel: 20, Star: 21.

Sources

  • Wikipedia’s lists of games was my starting point, although I had to make a lot of corrections and additions. I also visited hundreds of developer, publisher, and individual game pages.

  • Moby Games has lots of great information, including port teams, developer histories, and official website links.

  • The Giant Bomb wiki has a lot of more obscure titles and some info I couldn’t find anywhere else.

  • GameFAQs has pages for almost every obscure Japanese game.

  • RF Generation was useful for a list of eShop titles.

  • Nintendo has pages for most games released on their last few platforms.

  • Dolphin wiki for some info about Gamecube and Wii games.

  • Nintendo life for some Wii U eShop game information.

  • Youtube videos showing the splash screens as games start up.