Overview

A topic that comes up from time to time among Japanese Role-Playing Game enthusiasts is “what is the best system for JRPGs?” I look at these discussions and am often baffled by some of the things people suggest, but had nothing quantitative to back my opinions. As a big fan of the genre I have been wanting to do a project centered around them so I figured this would be an interesting thing to look into. In the process I also gathered a whole lot of data that is not related to game systems which I will also be going over.

Thankfully, a few days into the project and after realizing how many hours it would take just to decide what games from the Switch should be included, I saw a thread on /r/JRPG about a “JRPG Index” of every JRPG. This project may never have happened if I had not seen it, so thank you to JRPG Chronicles and the primary editor of its index, Lucca – more links in the Sources section.

While this project mostly sticks to games in the JRPG index, my rules are slightly different. Here are the requirements for games to be included in this study:

  • Developed in Japan or South Korea – Bug Fables and Child of Light do not count, but Crimson Gem Saga and Magna Carta: Crimson Stigmata do
  • Contains “enough” RPG elements – Monster Hunter and Dark Souls count
  • Officially licensed – no homebrew, RPG maker games, or fan translations
  • Released in North America and/or Europe
  • Released on a video game console – mobile, PC, and mini/classic consoles do not count
  • Not released on a 9th generation system – The PlayStation 5 and Xbox Series X/S were still very new when I started this project and there were very few JRPGs released for them
  • Released before 2021
  • Digital ports across generations are not counted if they are emulated and identical to their original version. So the Final Fantasy VII release on 8th generation hardware that has a speed up option and graphical improvements is counted, but PS one Classics on PS3 do not count
  • Games only available on a system as part of a subscription service, such as Nintendo Switch Online or Xbox Game Pass, do not count

Game Systems – Number of Games

It’s important to get an idea of what we’re working with first. Averages don’t mean as much if the data set is small, so I’ll be starting each section with the number of games relevant to what we’re talking about. Games released on multiple platforms are counted multiple times.

Clicking on the images will expand them. You can go to the next or previous image with the arrow keys, and close the lightbox with escape.

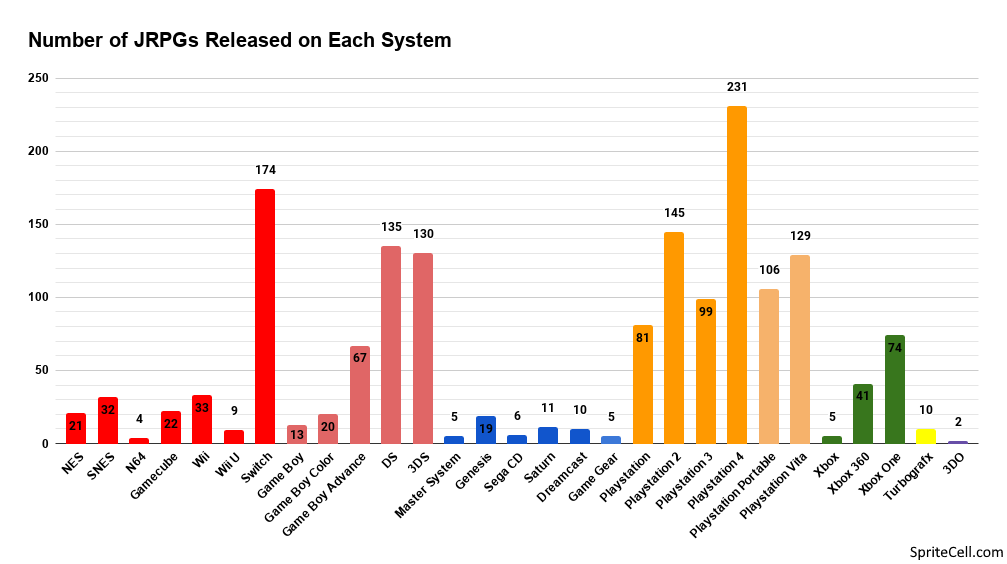
Within the parameters of this study, there are 21 home consoles and 8 handhelds with 1,639 JRPG releases. There are a few more systems with JRPGs, notably the WonderSwan, that weren’t included because they were only released in Japan.

An important aspect of determining the best JRPG system must the number of JRPGs. More games means more chances of finding a game you enjoy. The PlayStation 4 stands above everything else by a comfortable margin as of my cutoff date of 12/31/2020, and will see a few more. But while the Switch is #2 here, it is adding roughly 33% more JRPGs to its library per year than the PS4 has been, and it has several more years of life left in it, so it will likely end up pretty close by the time both systems stop receiving releases.

People often remark on how JRPGs mostly moved to handhelds with the 7th generation, and we can see that clearly here. The 7th generation was the birth of digital distribution on video game systems, and saw a big influx of games because of it, yet the PlayStation 3 has fewer JRPGs than the PlayStation 2 or PlayStation Portable. This is even more pronounced with the Wii and the DS.

It’s quite impressive that the Vita has more JRPGs than the PSP, despite selling so much worse.

Game Systems – Metascores

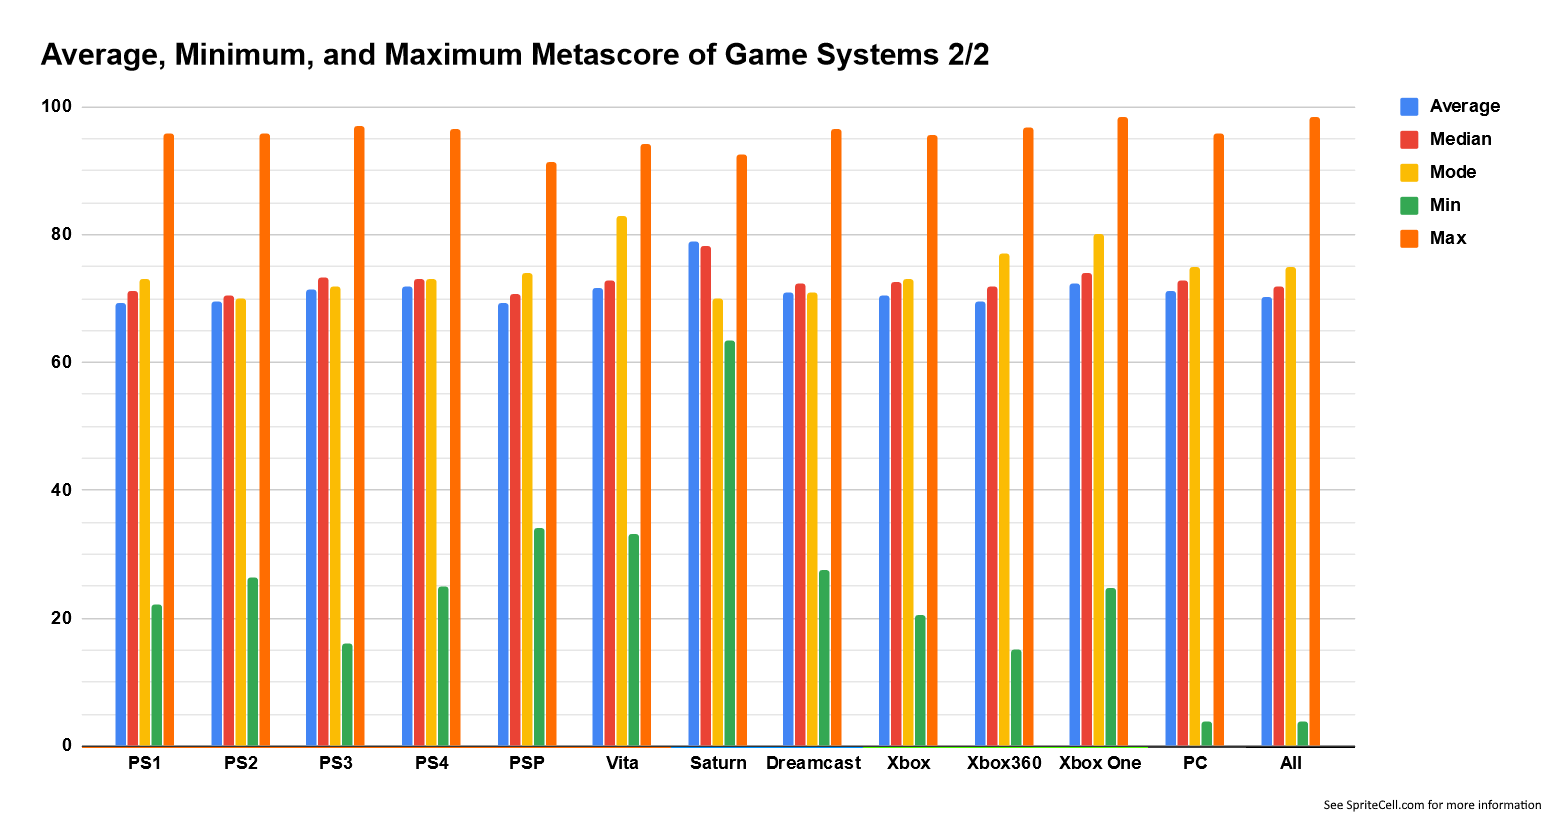
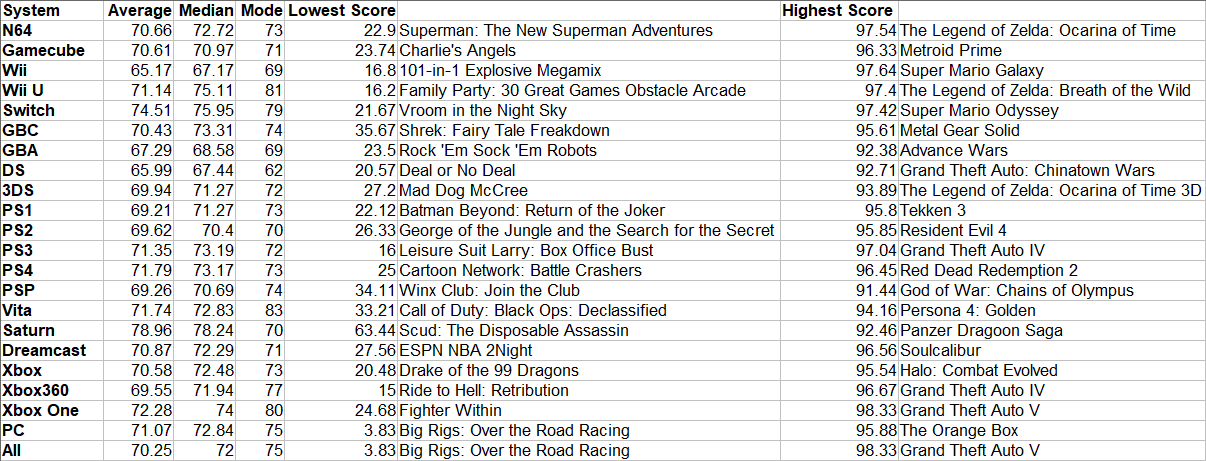
But it doesn’t matter how many games are on a system if they aren’t any good, so let’s look into the quality of the JRPGs on each system, first with metascores.

Most of these metascores are from GameRankings, which closed over a year ago. GameRankings displayed scores down to the hundredth decimal place, included older games than Metacritic, and did not weigh publications differently. Games without a GameRankings metascore used a Metacritic metascore when possible. For GameRankings I only included games with at least 5 reviews, and with Metacritic, 4 reviews.

While GameRankings has metascores for some older games there is a bit of selection bias for games released before the 6th generation. Typically only the most popular and best selling games have enough reviews, driving the overall average higher.

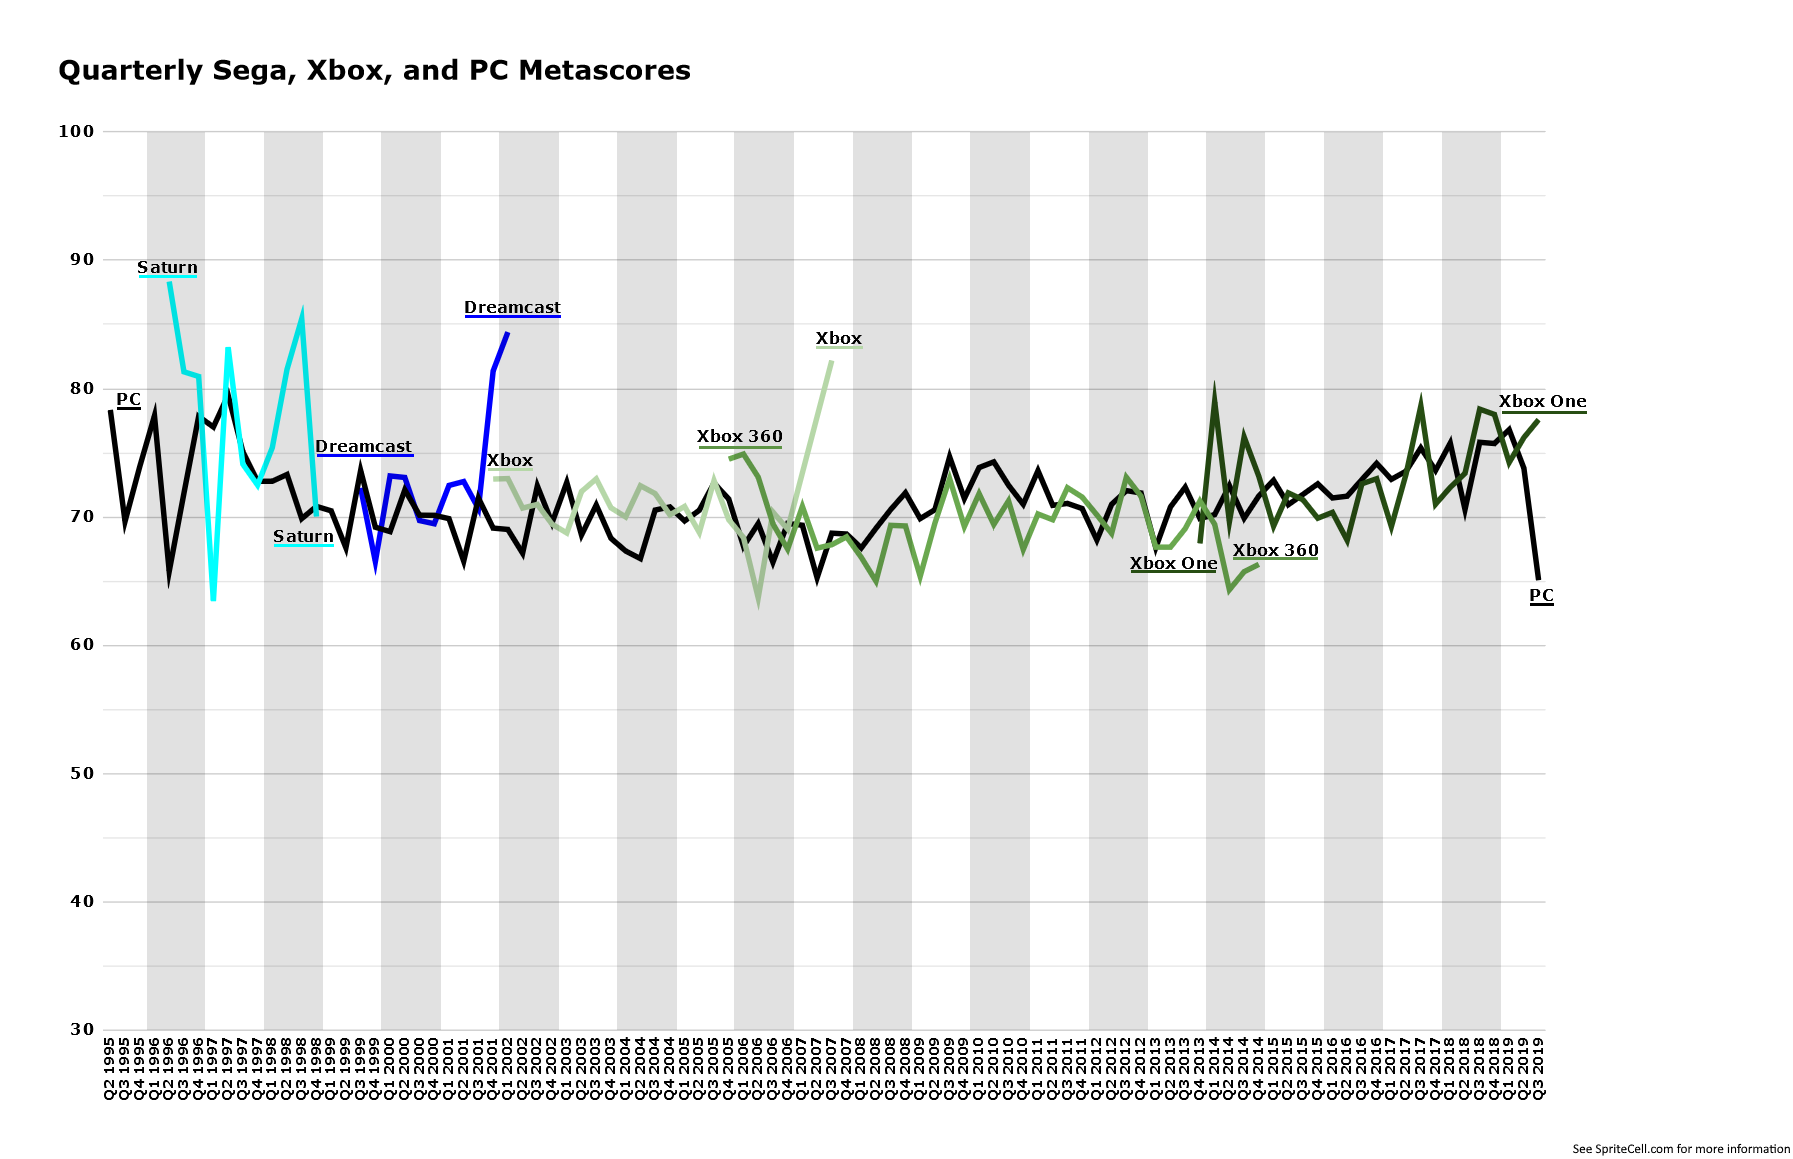
Systems without any metascores are omitted, and please also note that the y-axis starts at 60, making differences look larger than they actually are.

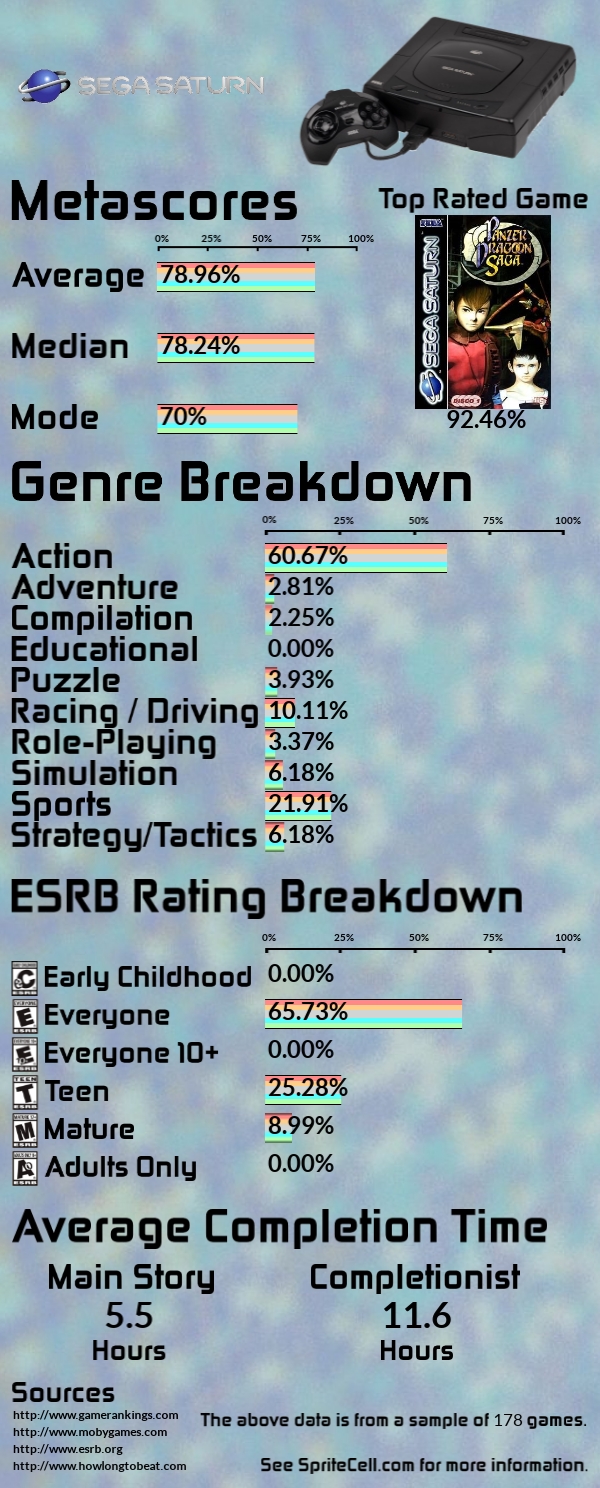
While the Sega CD and Saturn’s numbers look impressive, keep in mind that they had 3 and 8 games respectively with metascores and that the worst JRPGs didn’t get reviewed at all.

The Game Boy Color and Xbox One have more games to average, but are still rarely thought of as great JRPG systems. While the Xbox One got most of the same digital-only, small developer, low budget releases as the Switch and PS4, much fewer of them got reviewed, which helped its overall average tremendously.

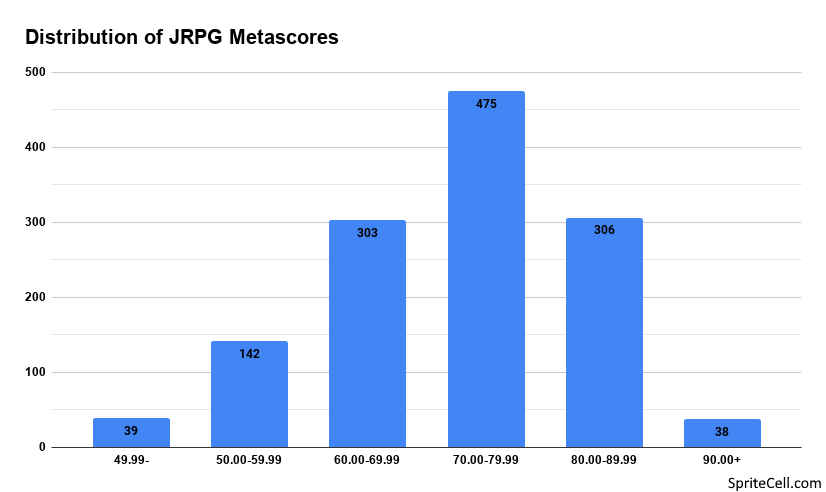
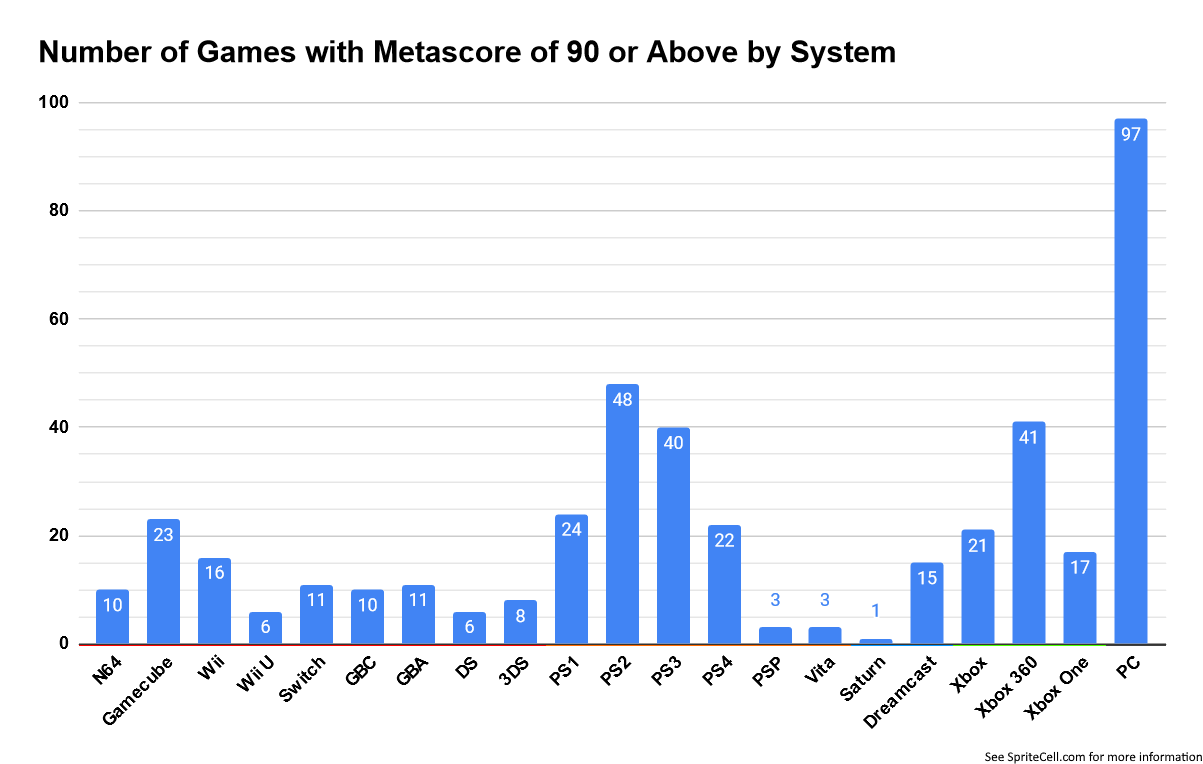
But the average doesn’t tell the whole story. What’s really important when you’re looking for a system to play JRPGs on is how many great JRPGs it has, right?

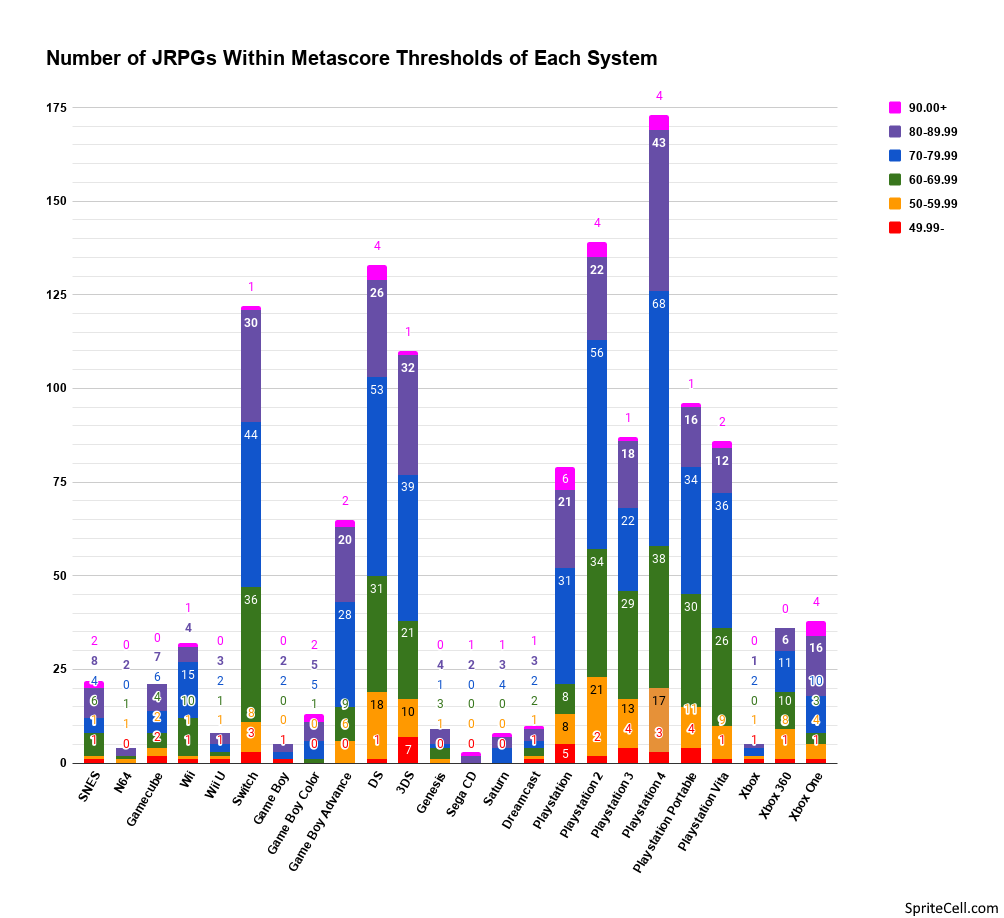
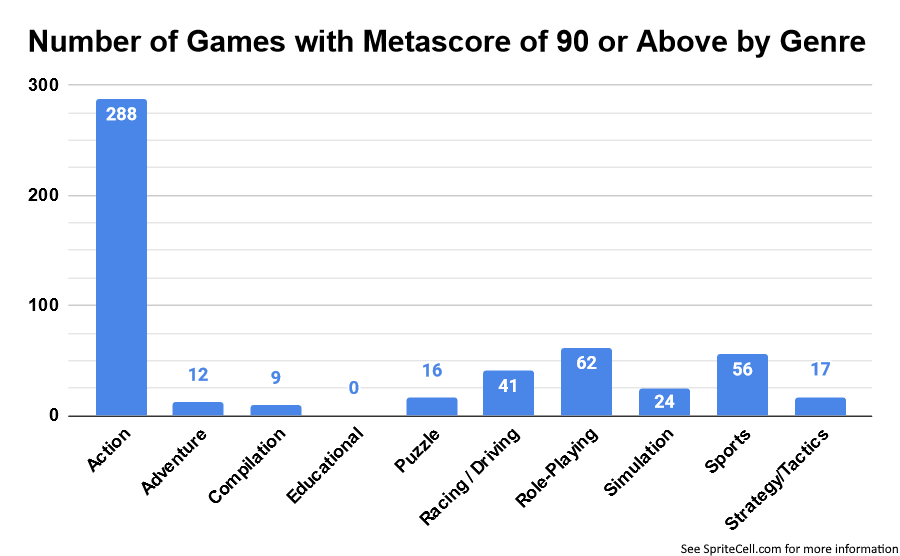
We have different ideas of how poor of a metascore might need to be before we wouldn’t consider looking at a game, and how high a metascore needs to be to really grab your attention, so here we have metascores broken into 10 point chunks.

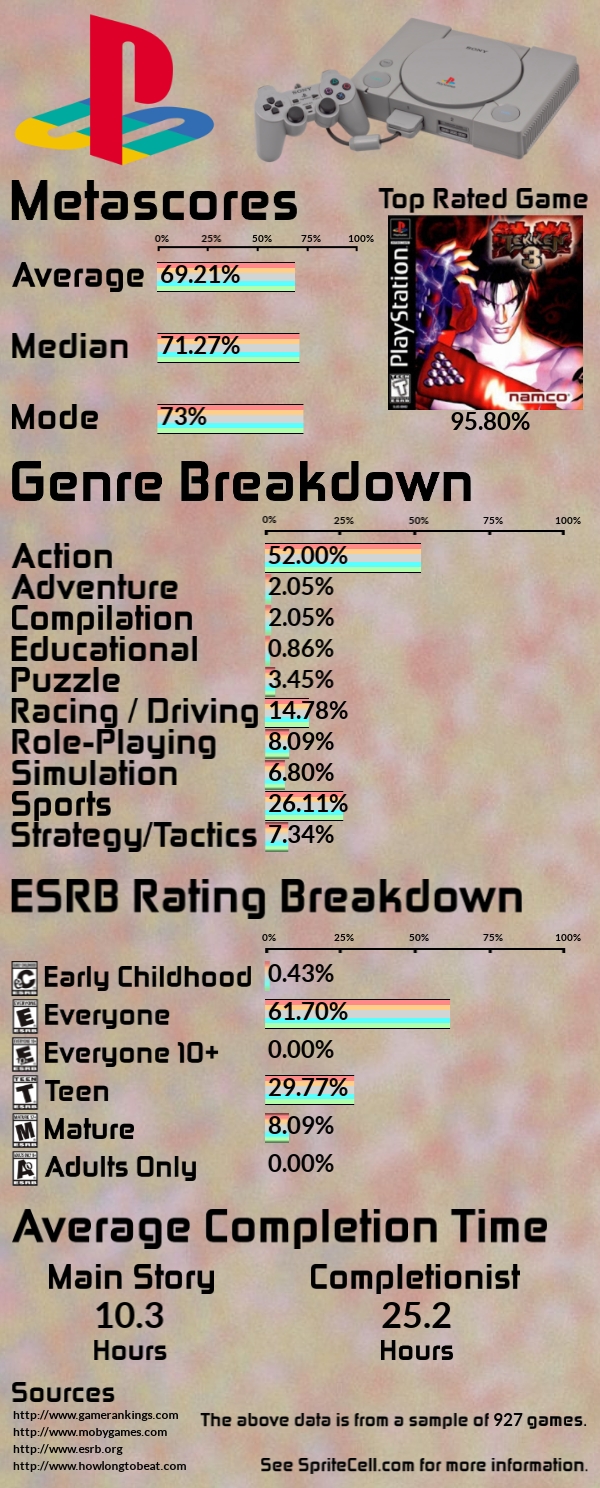
The original PlayStation has had the largest number of 90+ scored games, at 6, while the DS, PS2, PS4, and Xbox One have 4. While Sega had the two systems with the highest averages, there are only 3 90+ JRPGs in Sega’s history – Panzer Dragoon Saga, Lunar: Eternal Blue, and Skies of Arcadia.

Overall, there isn’t much difference between the relative proportions of these buckets among different systems, the 70s are the largest group, followed by 60s, or sometimes the 80s.

Game Systems – Polls

To get more of the “fans who don’t happen to work for a major game reviewing outlet” viewpoint I also looked at two polls to gauge how well different systems were received.

The first was held on /r/JRPG in late March 2020. 178 users voted for up to 10 games.

The second seems to have been advertised in many places, as there were over 1500 responses. I’m not sure when it started, but it was posted to /r/JRPG in early 2021. I am using the data from the “vote for your 10 favorite games” poll. Unfortunately, I can only see the top 100 games, so many games with a few votes were not counted.

I “normalized” the votes between these two polls so that they had equal weight, despite their difference in vote totals. This resulted in a number of “points” given to each game that received at least one vote. I multiplied the number by 100 so we didn’t have to deal with a bunch of zeros, so ultimately one vote in one poll is worth .7 points, and the most voted for game (Chrono Trigger) is 100. This is what I mean when I refer to “poll points”.

Before we get to the graphs, I feel it is important to discuss the relative merits of metascores and poll points.

All metascores are of their time, based on expectations for games coming out on those systems. Metascores cover many more games, no one voted for many mediocre to bad games in either poll. However, ports often do not get enough attention to receive a metascore, especially cross generational ones.

Retrospective fan polls can favor enduring classics and foundational childhood memories. Games that are not just good for their time is also an important factor here, as some game mechanics and quality of life issues that were considered normal at the time of a game’s release may be viewed harshly in the future. Polls also favor JRPGs ported across many consoles, as more people get a chance to play a game. I chose to give all versions of a game the full number of poll points, except when the polls specifically split them into separate releases. Since people have different personal definitions of JRPGs, some games that not everyone considers to qualify will receive fewer votes. Compilations did not receive any points if a game within them was voted for.

Systems with larger libraries have more opportunities to earn poll points and are also more top of mind, so it’s not much of a surprise to see the 8th generation doing so well overall, other than the Vita.

Chrono Trigger was the most voted for game in both polls and was worth 100 points, more than a third of the SNES and DS’s point totals.

Sega’s entire catalog of JRPGs was beat many individual systems.

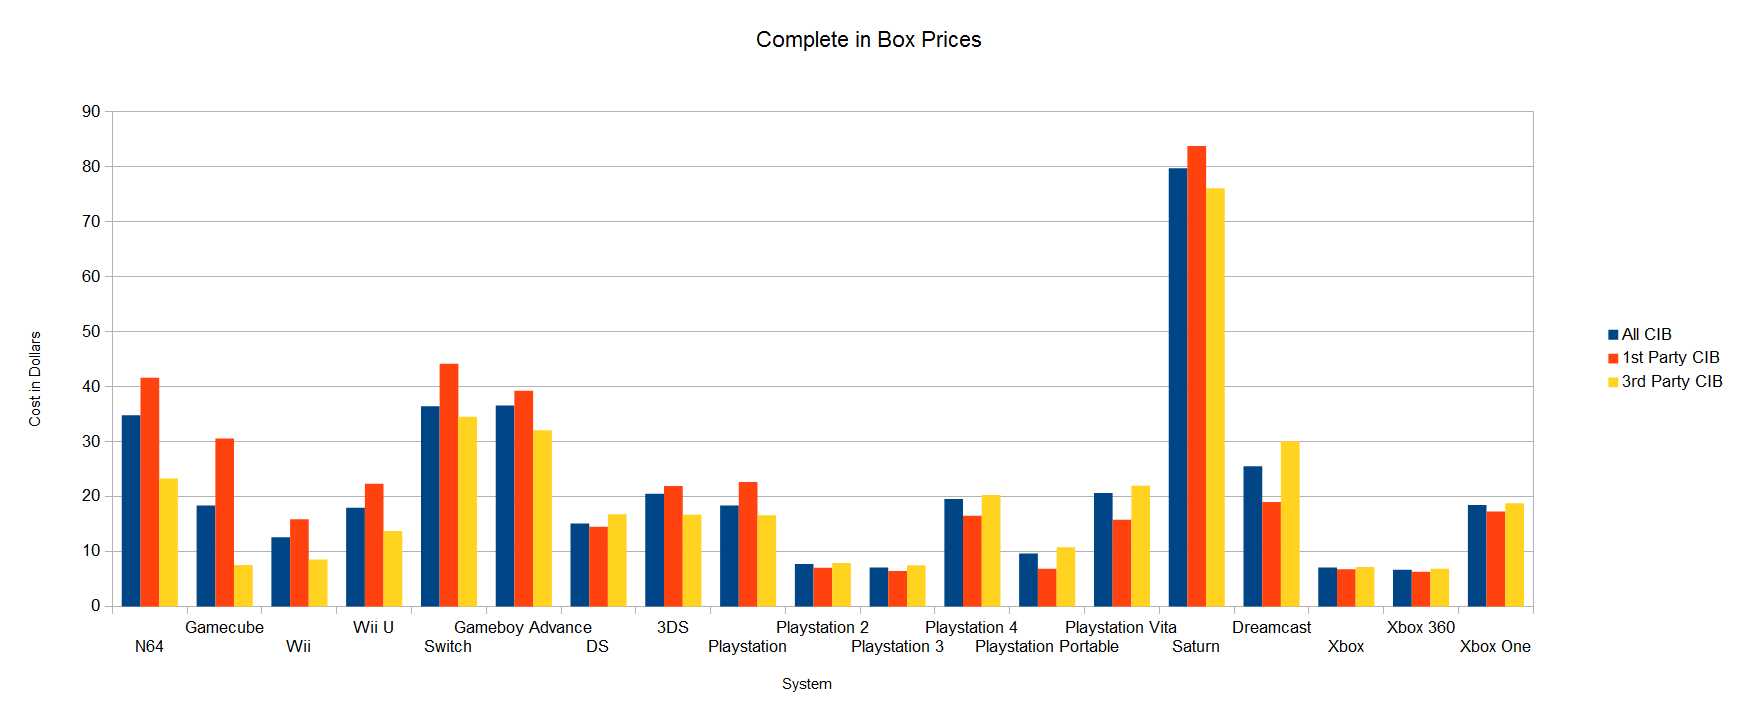
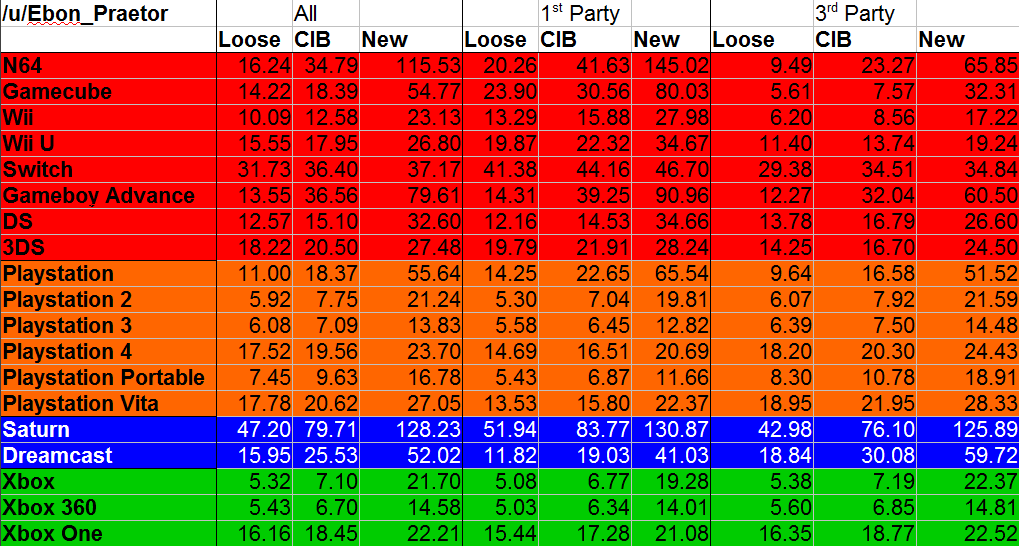
Game Systems – Physical Game Price

Physical game prices are always increasing, (studied in some detail here) making it difficult to play many of the best JRPGs on older systems. What good is a system if you can’t afford the games you want?

The following data is from PriceCharting, which analyzes games sold on eBay. The prices used in this study are of “complete in box” copies, which means the box, game, manual, and other inserts are included, but the shrink wrap has been removed and the game has likely been played. These prices are the most volatile data included and will be out of date the quickest. All prices are in United States Dollars. North American versions were used when possible.

If you’re curious about the overall average cost of a game on various systems, I have studied that too.

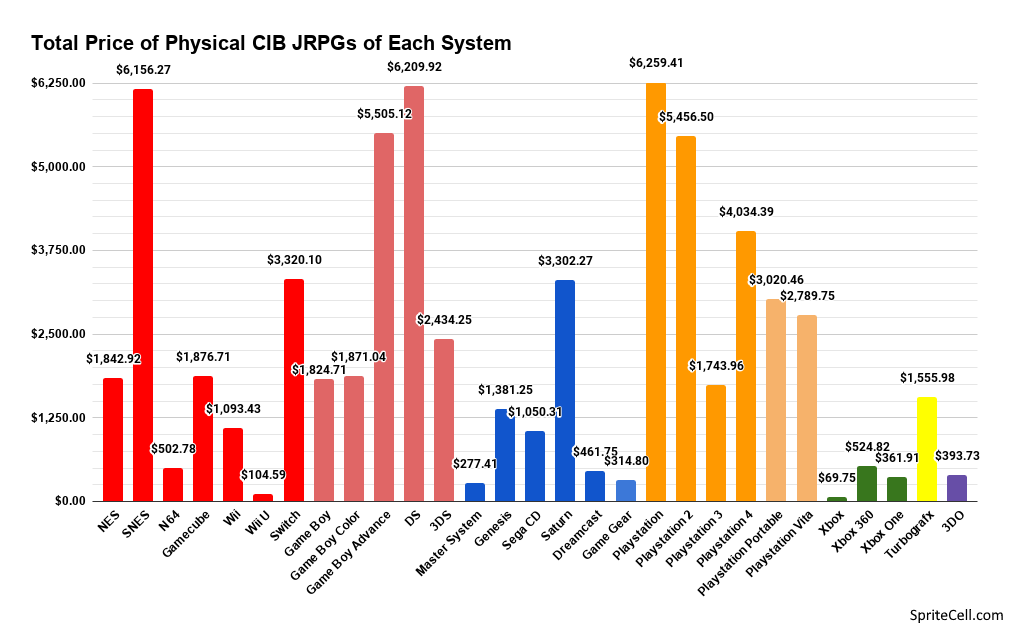
It will cost you $65,740.29 ($51.60 on average) to own a complete physical copy of every JRPG released before 2021, and that number is only getting bigger.

The SNES and PS1 are known for having many classics, and are often talked about as some of the best JRPG systems, but the DS is almost tied with them in terms of price.

While there aren’t many 3rd generation JRPGs, I was surprised how cheap they were overall.

The Saturn has several expensive games but Panzer Dragoon Saga, at $996.61, is carrying a lot of that price.

Game Systems – Digital Game Price

While I strongly prefer to have physical copies of my games, I understand many like to have digital copies instead. I did not record delisted games or anything from storefronts that have closed. All prices are without discounts.

I originally had a note here about the PS3 and PSVita storefronts closing, but that is no longer the case for now.

A complete digital collection of what is possible to buy at the moment will cost you $24,821.07 ($28.53 on average).

As digital prices are more standardized (more on price distributions later), total digital cost tracks closely with number of JRPGs.

Game Systems – Cheapest Versions

Maybe you’re agnostic about the format of your games and are happy to buy whichever is cheaper.

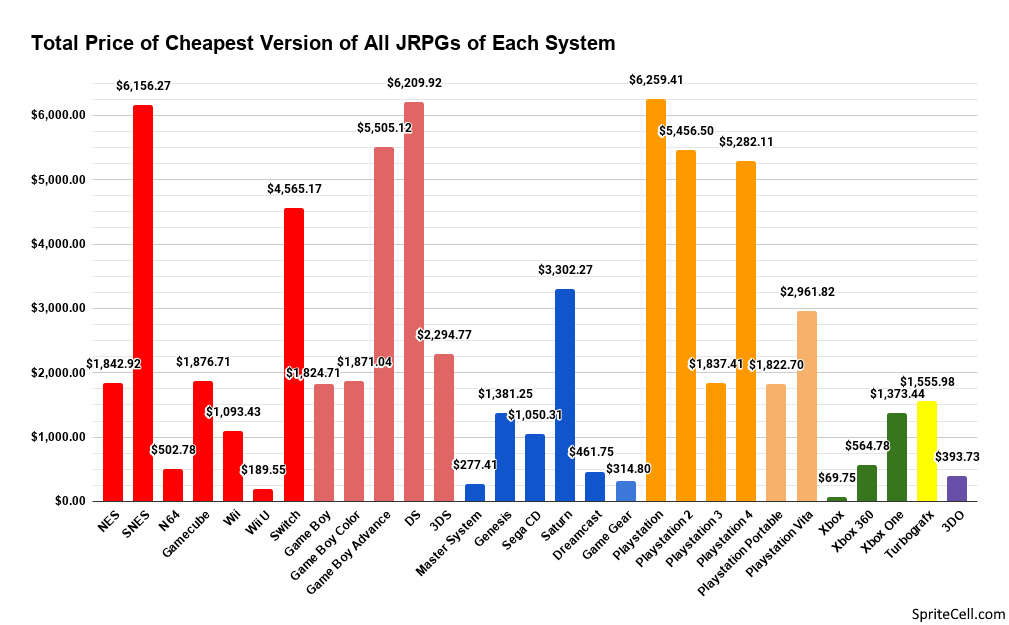
A complete collection of JRPGs, buying only the cheapest format, comes to $68,297.81. This is more expensive than either a complete physical or digital set, as it includes all physical-only and all digital-only games.

Systems without active digital storefronts have the same prices as the physical copies graph, but Switch, PS4, and Xbox One see a sizeable increase in the price of a complete collection.

Game Systems – Exclusivity

Some games get ported many times across multiple generations, while some are forever stuck on one system. In choosing the best JRPG system I feel that one must consider the exclusives.

For the purposes of exclusivity data (and no other data in this study) I have included ports to any system, including mobile, PC, and emulated ports. They still need to have been released in North America and/or Europe.

The two screen handhelds with touch controls are difficult to adapt to other systems, leaving many of their games stranded. I was surprised so many PS2 games have never found homes anywhere else.

Much of Sega’s JRPG library has ended up on various Nintendo systems.

The 3DO may only have 2 JRPGs, but it’s the only place you can play them.

The Saturn was an outlier in many ways but I’m still not sure why so few games managed to escape its orbit.

The 7th and 8th generation saw quickly declining exclusivity in terms of the North America, Europe, and Japan regions, so I wasn’t surprised to see system exclusivity also fall.

That’s it for the best system section. Did you find a new system to explore? I will have some final thoughts on what the best JRPG system is in the wrapup section. But I still have a lot of other data to show off.

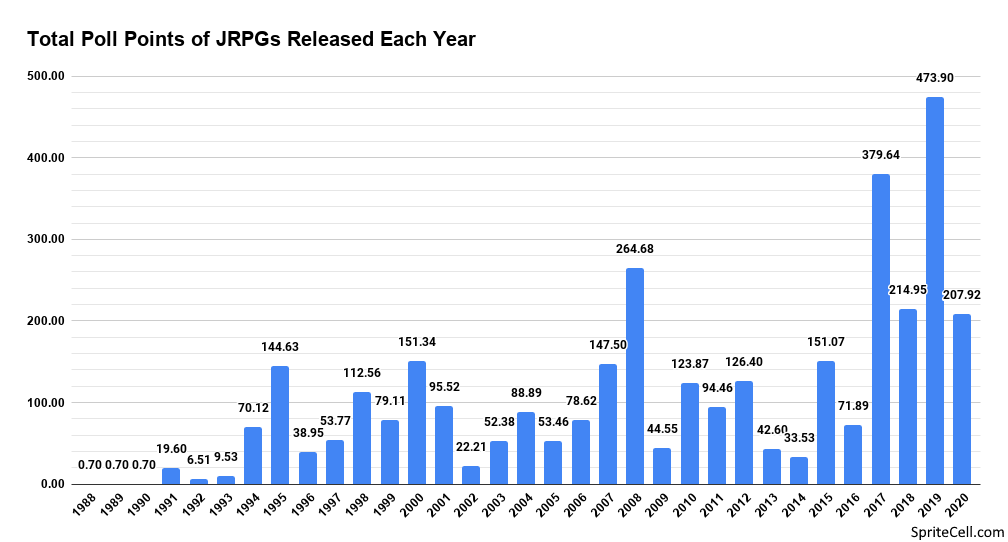
Years – Number of Games

All games use the year of release in North America, unless they are a European exclusive, in which case their European release date is used.

For many games released in the 3rd and 4th generation only a year and month is known. In this case I entered the date as the first day of the month.

There are many games in this uncertain era that are listed as coming out on the last day of the month, including on days of the week that games have rarely been released on. These dates are consistent across sources even though it is very unlikely that they were actually released on that date. Games rarely even had definitive release dates back then, but these dates have been parroted around without disclaimers.

Dragon Quest is often said to be the first JRPG, but it took over 3 years to reach North America. It was the 9th JRPG to leave Japan.

As release dates for games of this era are hard to pin down it’s difficult to be certain, but Miracle Warriors: Seal of the Dark Lord for the Sega Master System appears to have been the first JRPG to reach North America or Europe, coming out in January of 1988. Not a game you hear about often.

Generally, more JRPGs come out every year, but I’m quite puzzled by 2012 and the surrounding years. This was around the time the 3DS, PlayStation Vita, and PlayStation 4 launched. Looking at my study on release dates, there were also fewer overall games released around this time, centered around 2013.
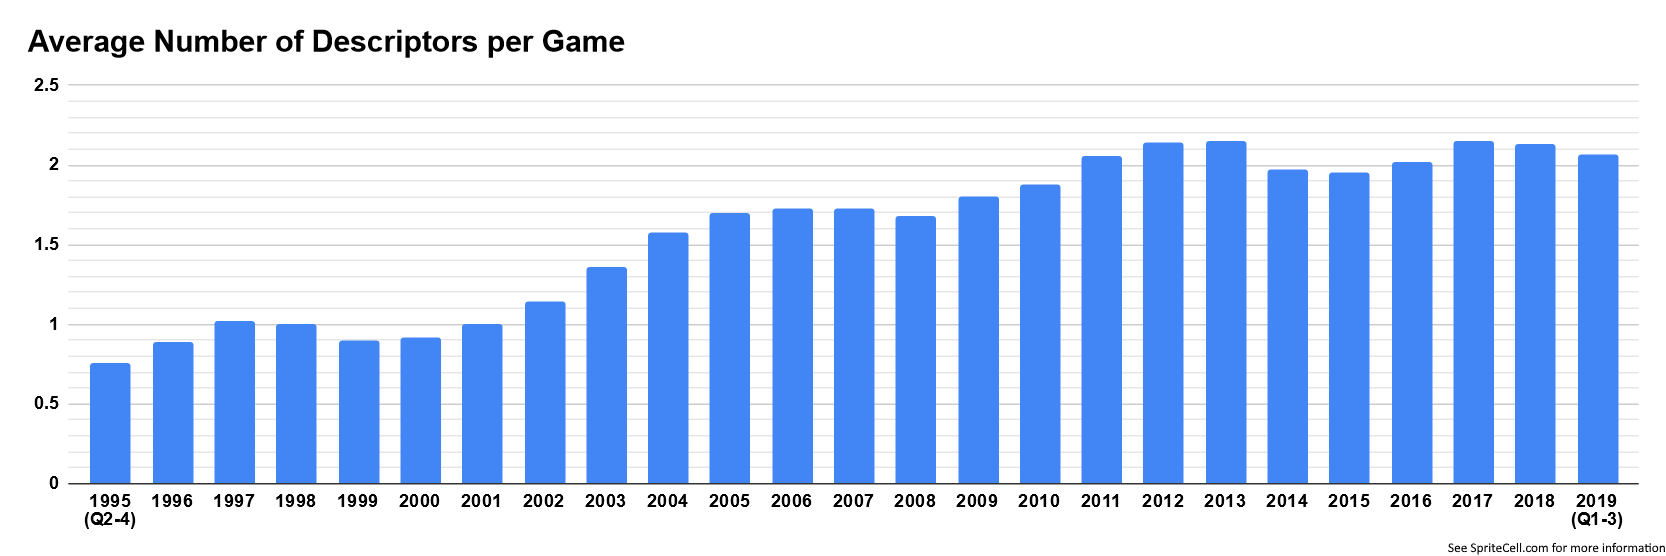
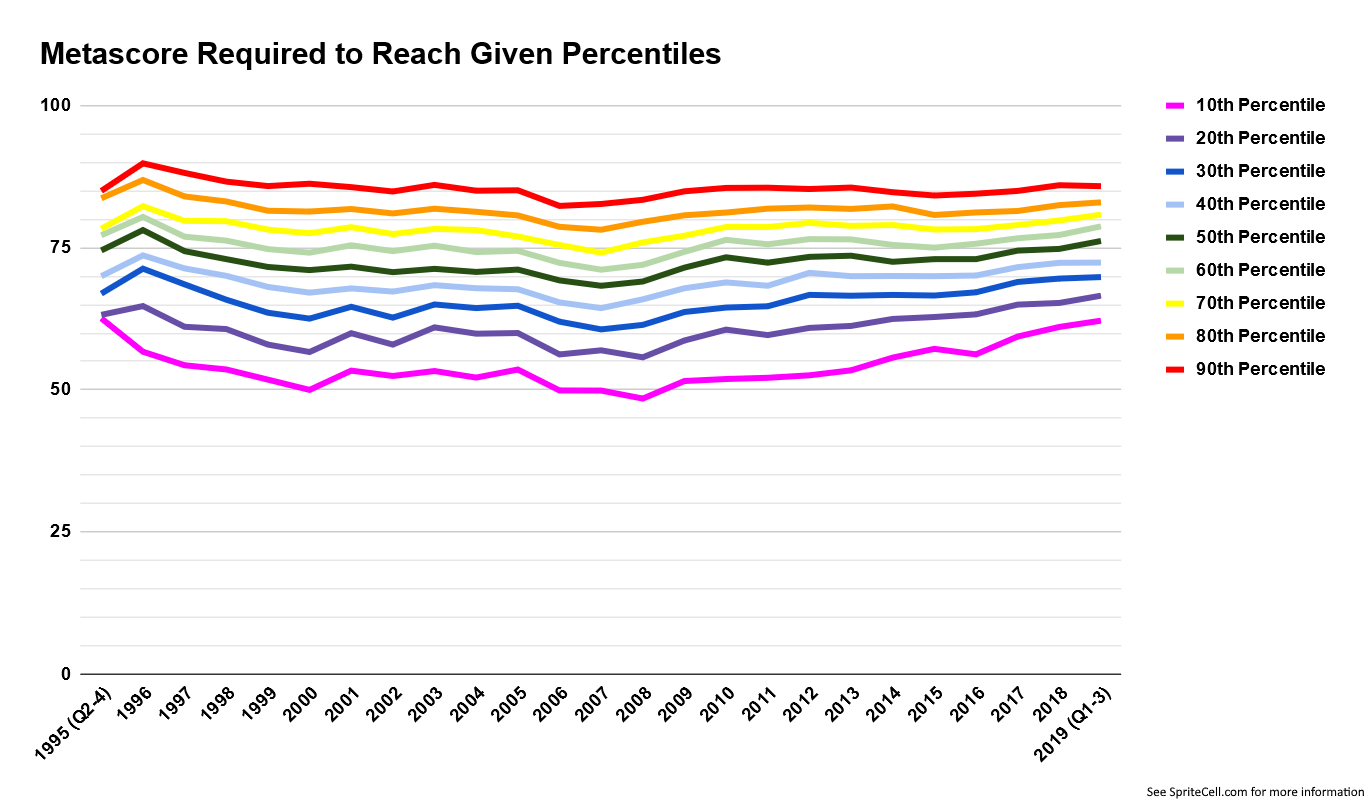
Years – Metascores

What year do you think had the best JRPGs? Would it be near the end of the SNES era when 2D game development had been refined? Maybe during the PS2 when games still didn’t take too long to develop and there was still a lot of experimentation?

Please note that the y-axis starts at 50.

JRPGs did not review well at first, but their scores grew quickly every year until they reached their all time high in 1995. The best scoring games of that year were Chrono Trigger, Lunar: Eternal Blue, and Earthbound.

The JRPG genre sticks closely with overall metascore trends, where 2007 was also the worst year in gaming, metascore-wise

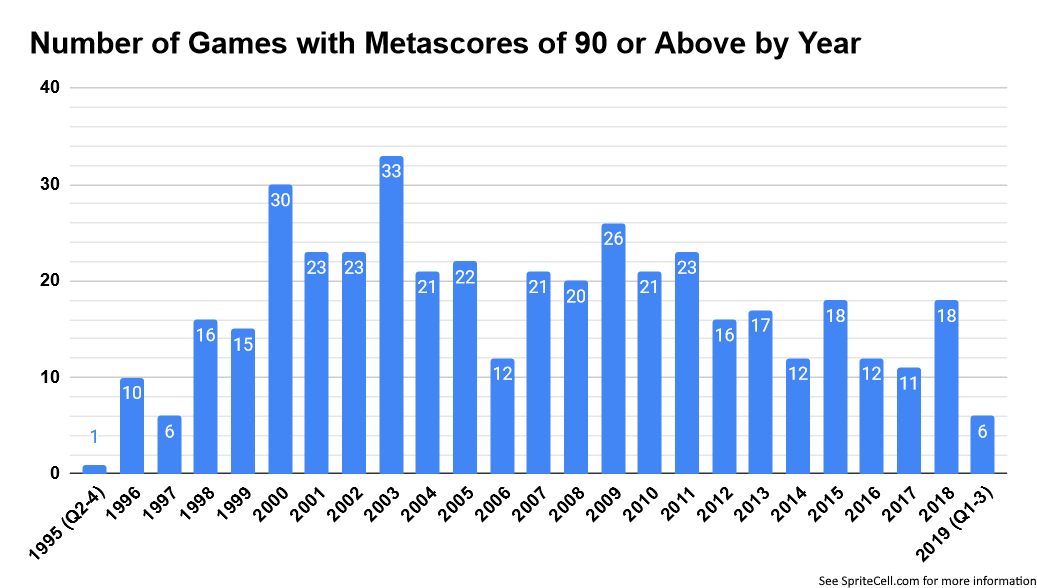
On the other hand, 2000 doesn’t stand out in terms of averages, yet 5 90+ JRPGs were released that year, and 2020 is not far behind.

2012 for some reason only managed 6 JRPGs with an 80+ metascore.

Years – Polls

But maybe retrospective fan polls tell a different story than current-at-the-time reviews?

Much less nostalgic than I would have guessed, and bit of recency bias instead. Since the people voting in these polls are probably mostly in their 20s, it’s natural to see fewer older games. Much bigger differences between adjacent years than the metascores.

100 of 1995’s and 2008’s points come from Chrono Trigger. Very different years without it.

Only 4 games from 2002 received any poll points, Kingdom Hearts chief among them.

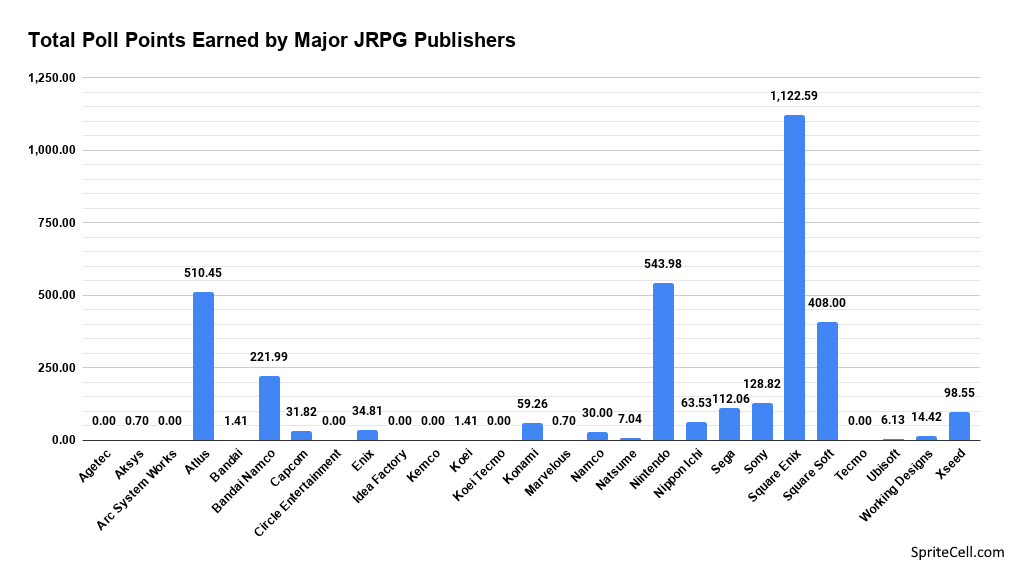
Publishers – Number of Games

It may seem to make more sense to study developers than publishers. Developers make the games, after all. While that’s true, publishers exercise varying control over how a game turns out and many are developed and published by the same company. There’s also many more developers, many of which have short lives, are bought and sold to different companies, and don’t make a statistically significant number of games.

I didn’t do any combining of companies based on ownership, I just kept it to how they were credited, much to Atlus’s favor. Only publishers with at least 10 releases are included. North American publishers are used when possible.

Square Enix have dominated the JRPG genre since it was created 18 years ago. Not just Final Fantasy games but also many higher budget games that they don’t develop.

Nintendo isn’t particularly known for publishing JRPGs, but their age, their willingness to bring some games overseas when the original publisher isn’t interested, and the many Pokémon games are enough for second place.

Kemco has a long history, but it wasn’t until the last decade or so that they started cranking out cheap mobile JRPGs, and then porting them to every other system possible.

Publishers – Metascores

Working Designs was a somewhat controversial and short lived publisher known for their elaborate special editions, but comes out on top in terms of metascore.

Some people feel like Square became a shell of themselves after their merger with Enix, and there is a noticeable drop in scores.

Nintendo maintains quite a large average considering their output.

Few of Kemco’s games even get enough reviews to qualify for a metascore, but when they do, it isn’t pretty.

Publishers – Polls

Square Enix wins out on fan acclaim, with Nintendo and Atlus also pretty proportionate to the number of releases under their belt.

Nippon Ichi and Kemco really don’t make much of an impression despite their large number of JRPGs. 122 Kemco releases, and not a single person counted any of them among their favorite.

It’s not entirely fair to compare publishers with many titles against those with a few, so here is the average number of poll points per release.

Square Soft gets a big boost here, with most of its games making someone’s favorites list, while Square Enix gets a big drop.

Sony also fares a bit better, but this way of looking at the data doesn’t change much else.

Series – Number of Games

Publisher loyalty isn’t common, so let’s get angry and argue about what the best JRPG series is. Series had to include at least 5 distinct games without ports. All spinoffs were included. How many do you think qualified?

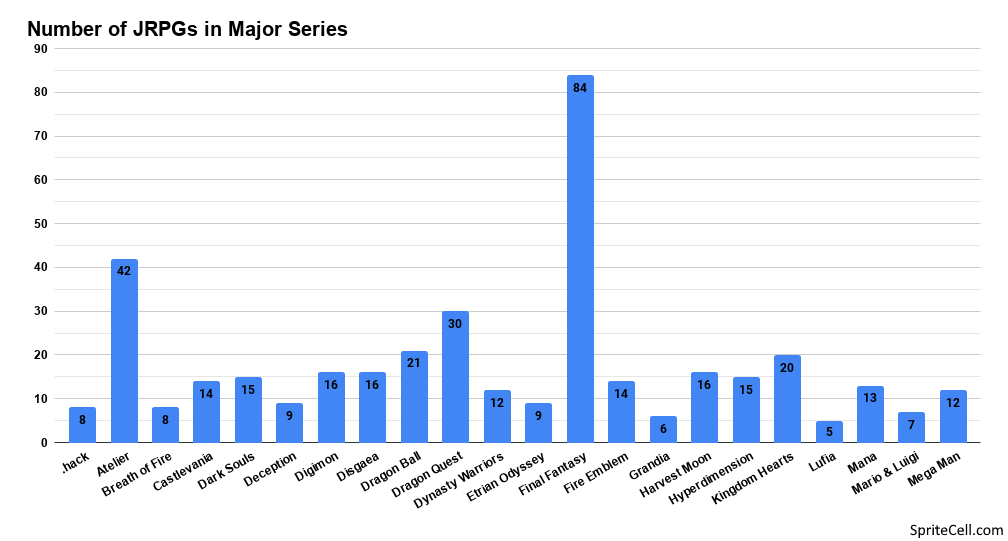
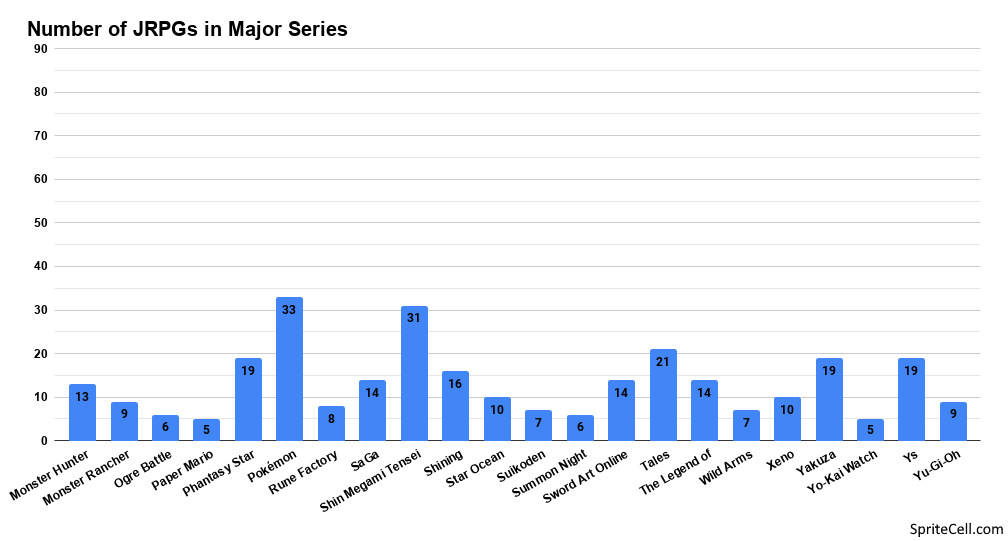
Forty-four, enough to have to split them into two graphs. Hyperdimension Neptunia and The Legend of Heroes got a bit cut off to fit better.

With a long history, many spinoffs, many remakes, and many ports, Final Fantasy is by far the most prolific JRPG series.

Atelier has been releasing games almost every year, porting them widely, and remaking some of them, but few people would probably guess that it’s #2 in terms of total games.

Series – Metascores

The y-axis again starts at 50 to exaggerate differences.

The Dark Souls series are not traditional JRPGs, but only two of its releases have scored below 85, earning it highest overall.

The Xenogears, Xenosaga, and Xenoblade games are much more eclectic but have done very well overall.

I was surprised to see Shin Megami Tensei (which includes Persona) so high up, with 31 games it’s difficult to keep the average so high.

Drakengard+Nier are a loose series that I forgot to include, but their metascore average is 72.5.

When I look back at old gaming magazines there were quite a few articles about Yu-Gi-Oh and Digimon being potential Pokémon killers, so it’s funny to see them dead last.

Series – Polls

Final Fantasy, with its large amount of titles and long legacy takes the most poll points by a large margin.

Chrono Trigger (both releases) and Chrono Cross aren’t a large enough series to be included, but if they were, they’d rank fourth, just under Dragon Quest.

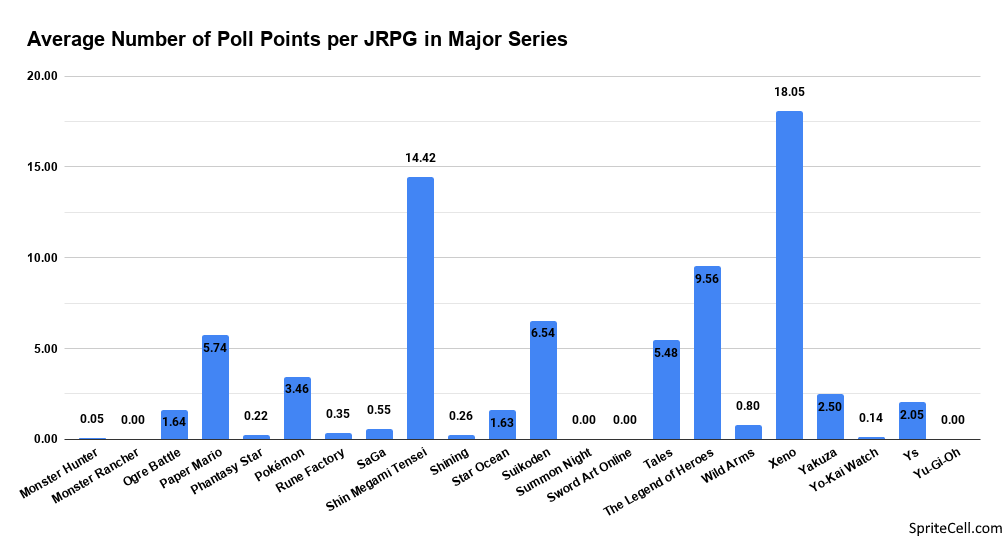
As with publishers, it may be more meaningful to look at the average number of poll points per game, rather than the total.

Xeno, with only Xenosaga Episode II not getting any points, takes the crown from Final Fantasy.

The Legend of Heroes also gets a boost, while Shin Megami Tensei and Dragon Quest stay close to their original positions.

Big 4 Hardware Makers

Four large hardware makers have dominated the video games market: Nintendo, Sega, Sony, and Microsoft. Sometimes people discuss not just the best systems, but the best hardware company. With so many games over such a long period, and so many other factors to consider, I’m not sure this is very meaningful, but I still wanted to see who came out on top.

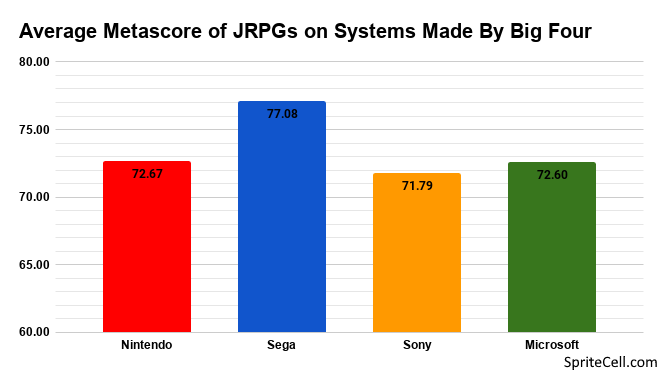
Y-axis starts at 60, so please keep in mind the overall range here is only 5.29.

The relatively small number of JRPGs released and also considered worthy of review on Sega systems overall scored quite well. Sony’s average is no doubt hurt by its huge library.

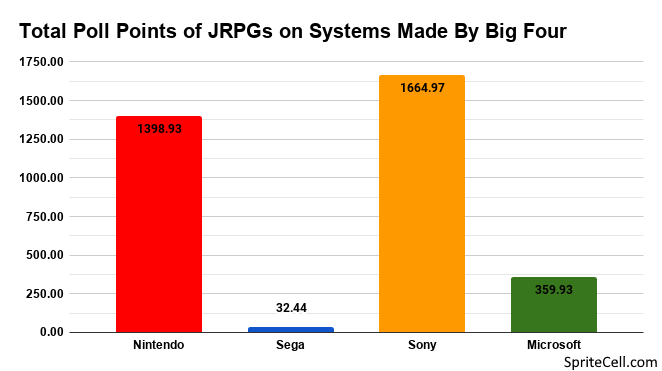
In terms of people’s overall favorite games, though, Sony has a solid lead over Nintendo, while Microsoft and Sega are nowhere close.

Miscellaneous Findings

I have several more graphs that didn’t fit in elsewhere. I won’t always have a lot to say about them, and most are small.

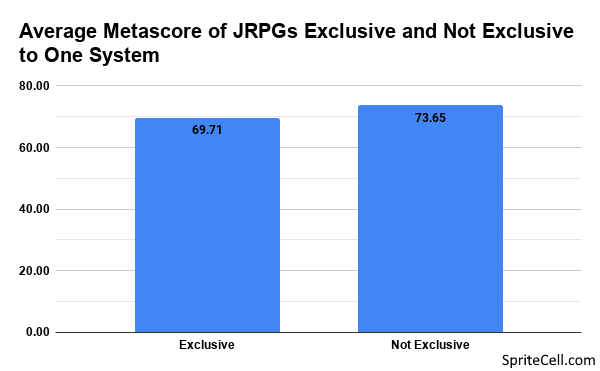
While exclusives are a big draw for a system, they are a bit worse on average. Overall I would say they are more likely to be low budget games that sell less than non-exclusives and would not make a worthwhile amount of money to port.

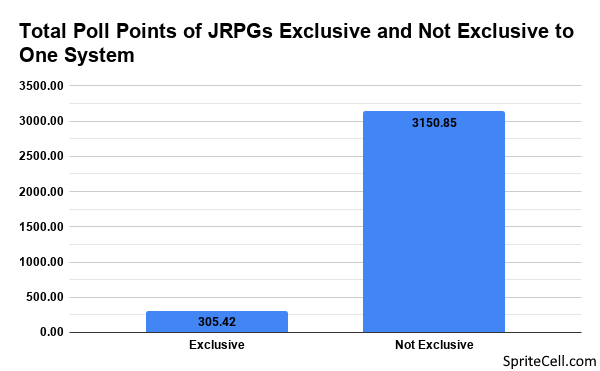
The difference is much more pronounced with poll points.


Physical versions of exclusives fetch higher prices overall, while digital versions cost a bit less.

While the smaller budget exclusives have to charge less to stay competitive, the secondhand physical market covets them and sees them as rarer and more valuable.

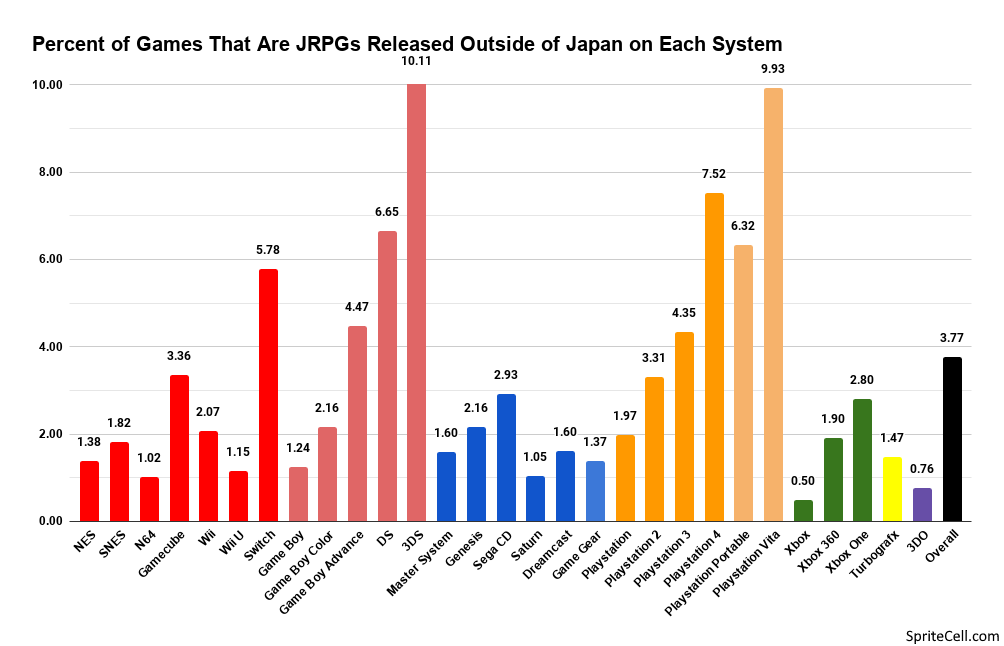
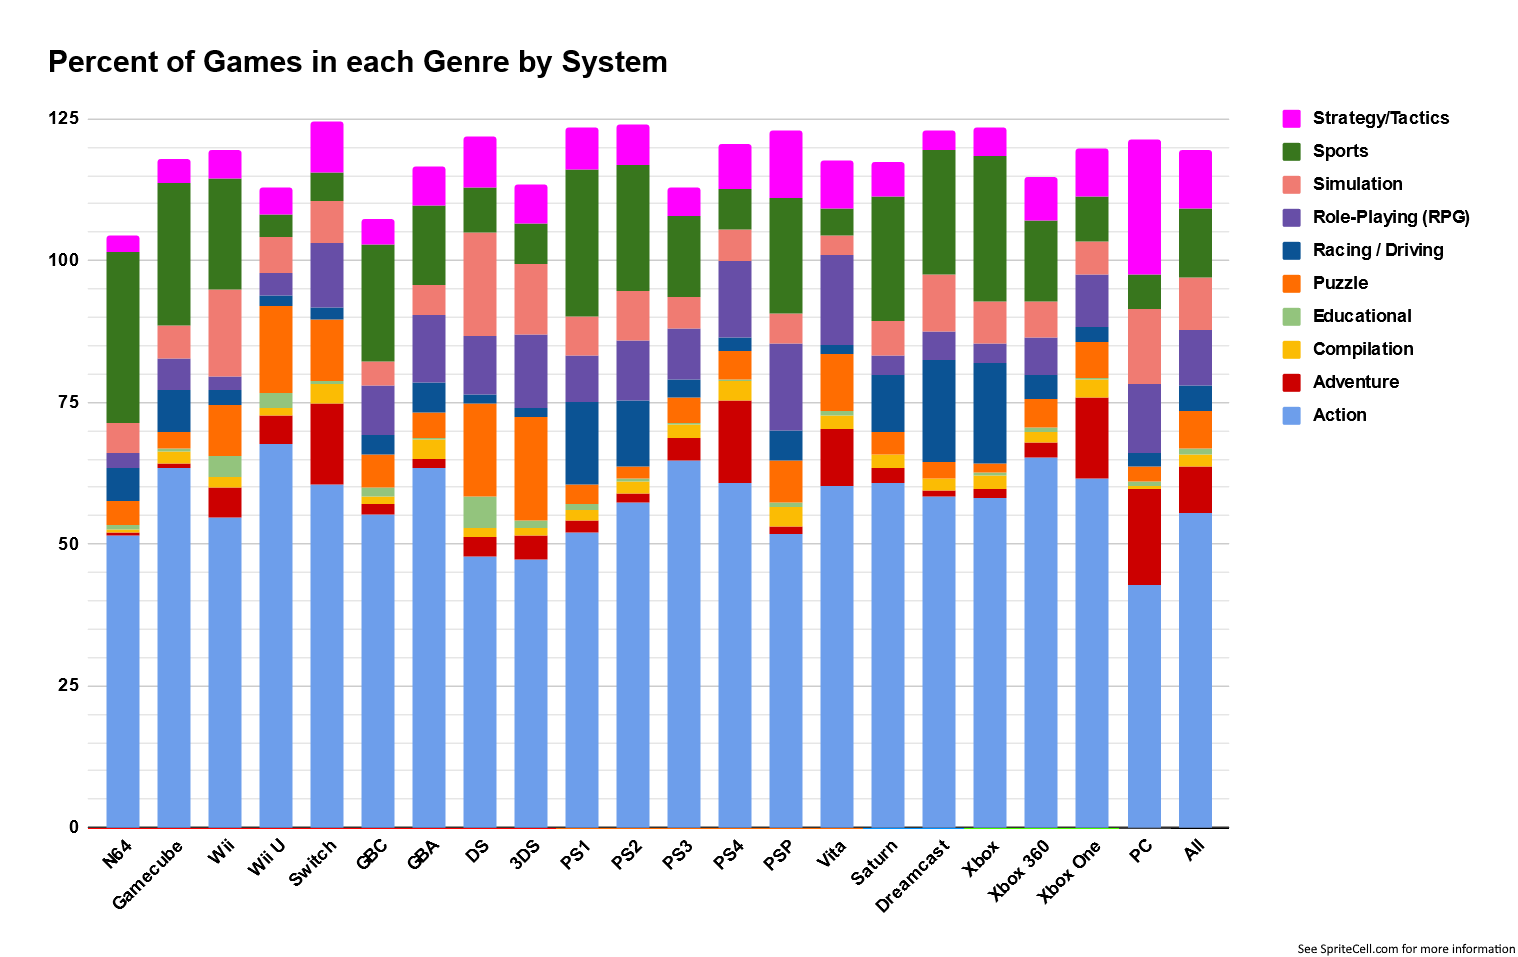
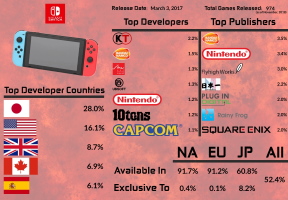
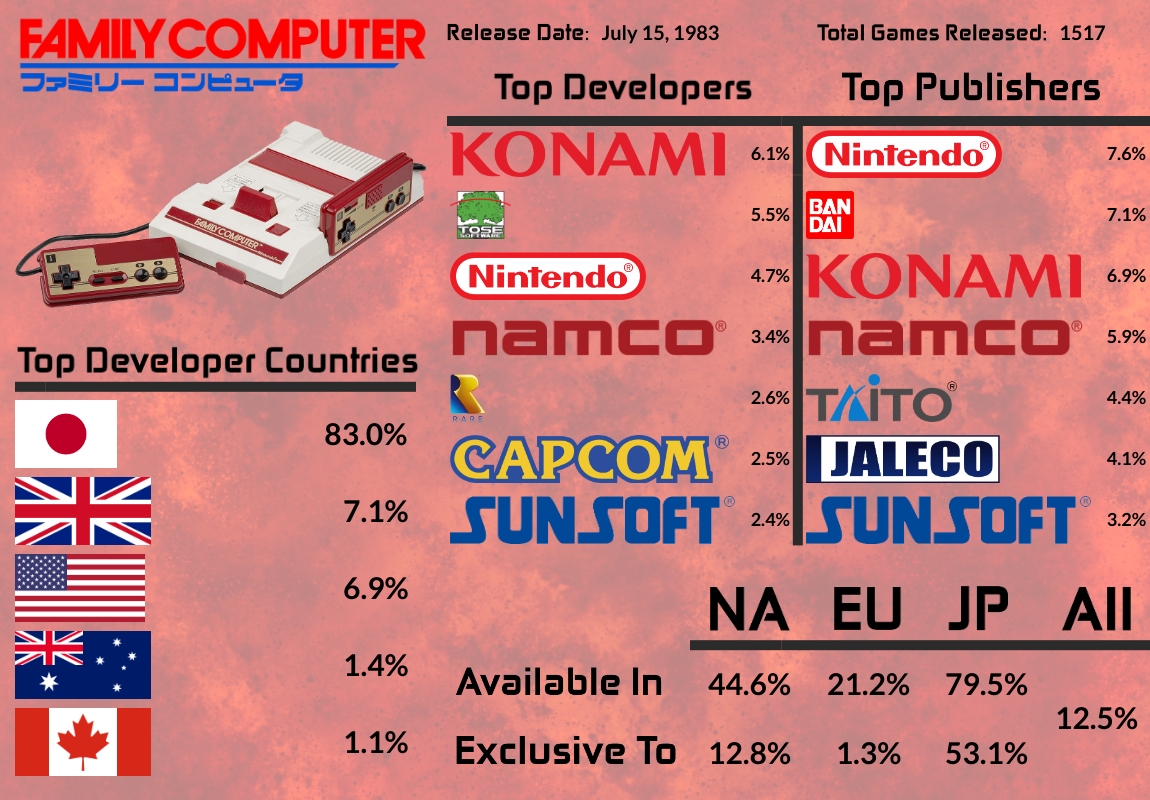
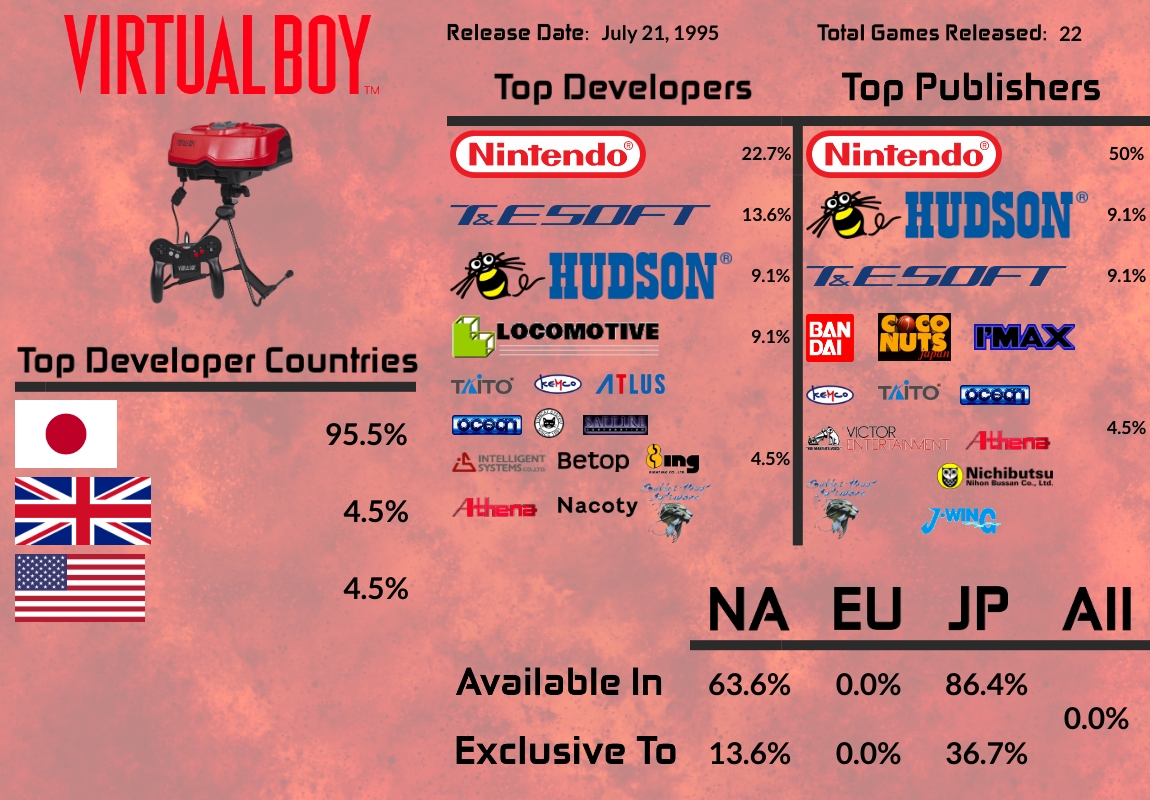
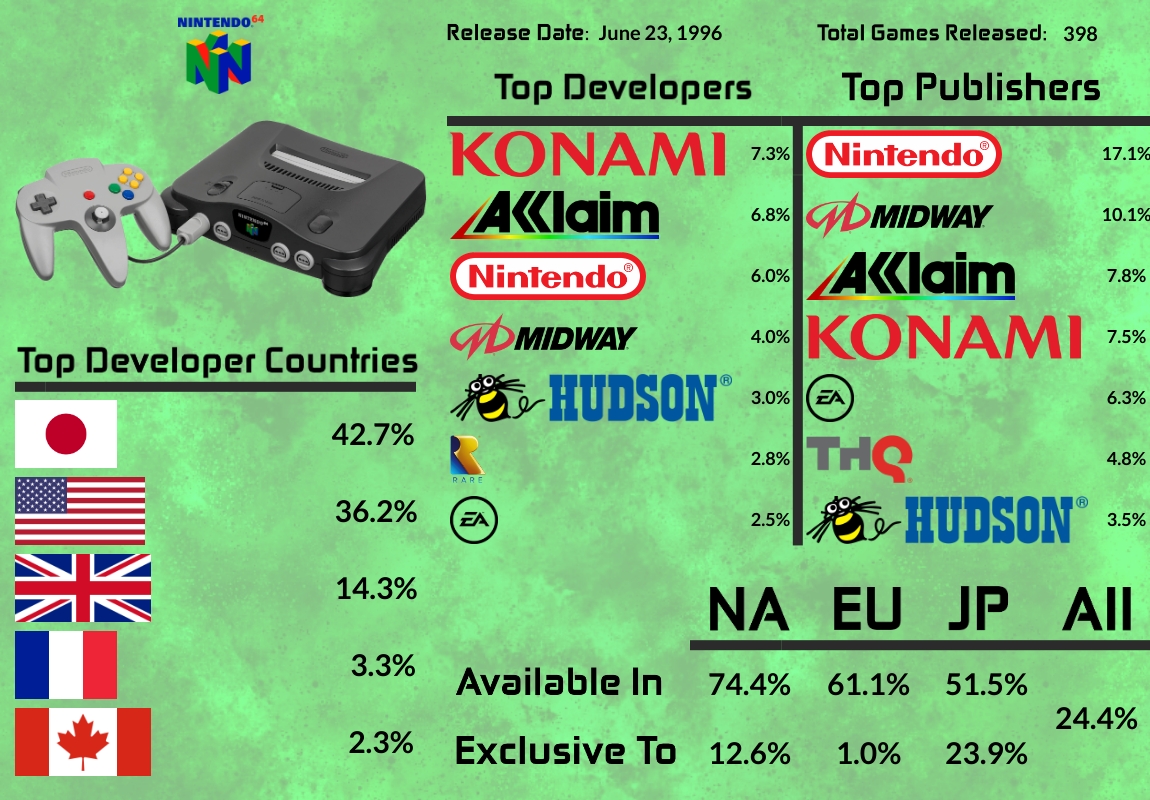
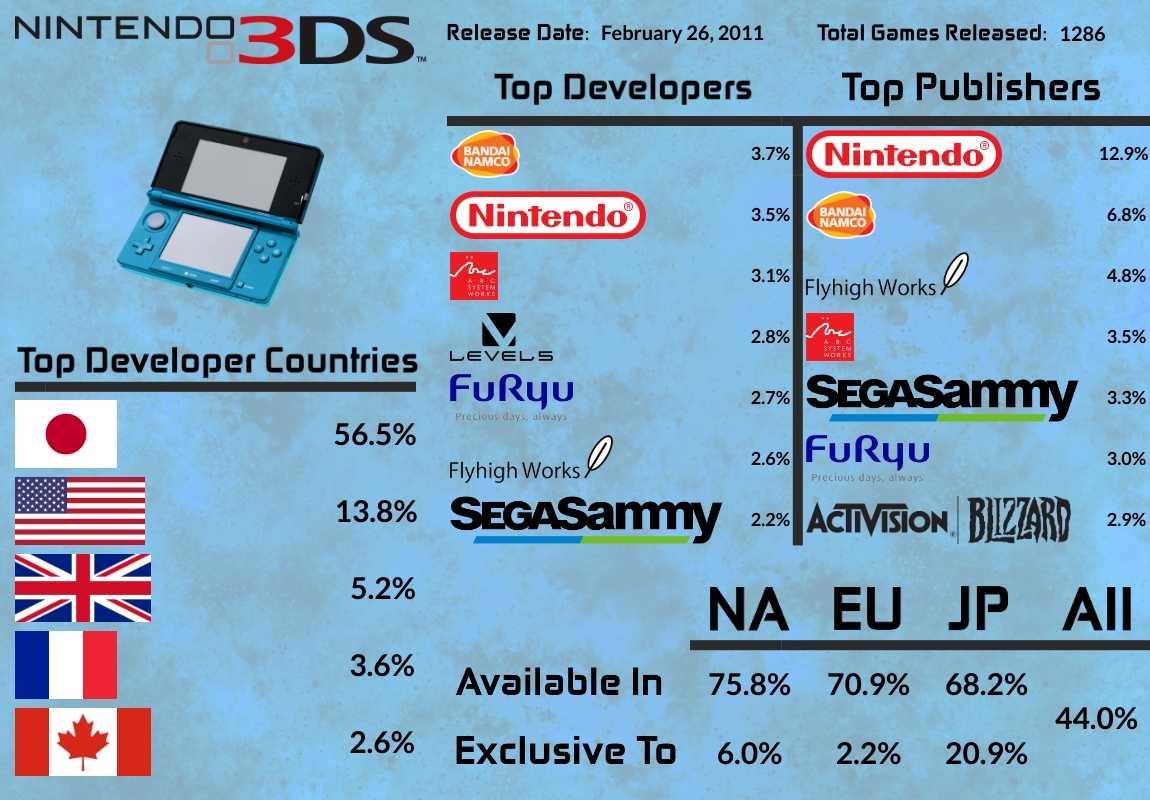
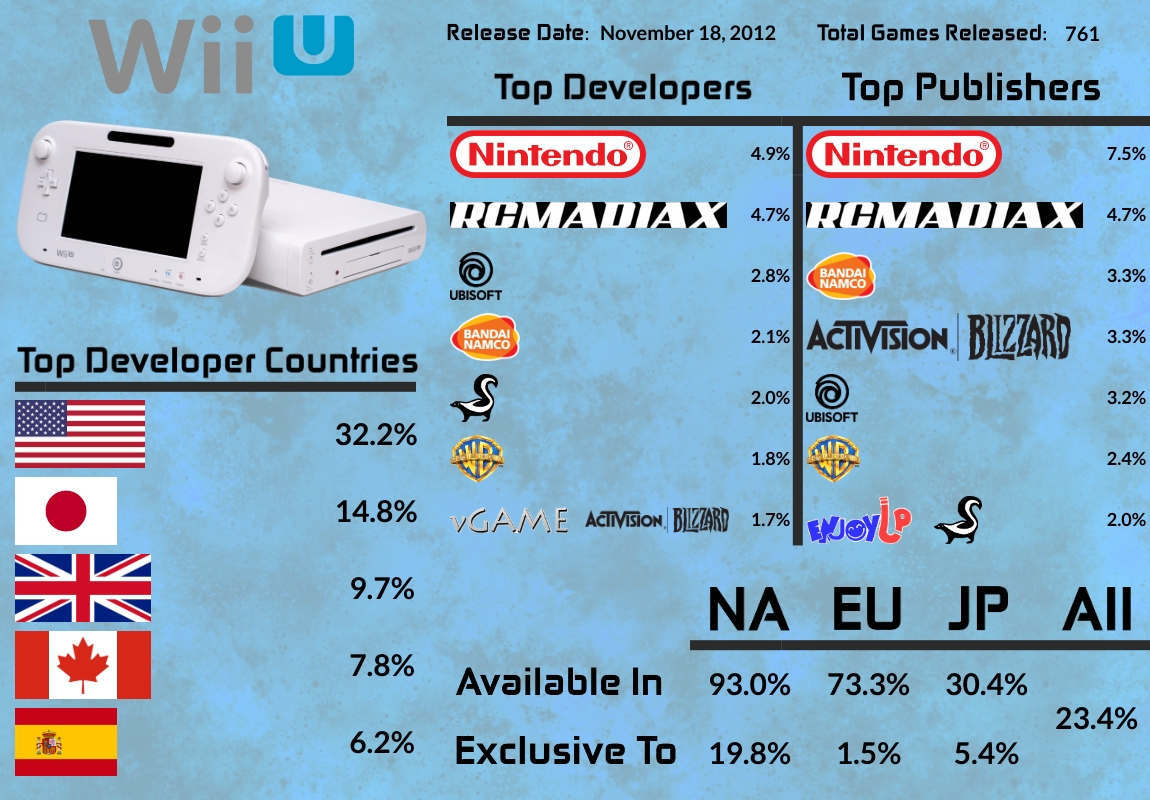
This is not just the percent of a system’s library that is a JRPG, but a JRPG that released in North America or Europe. This is a bit more speculative and harder to measure exactly than the other data that is part of this project. I used the number of releases according to wikipedia’s lists of games for each system, not including anything after 2020. These lists have different criteria for inclusion and recieve different amounts of care.

Another thing to consider is that fewer and fewer games remain Japan-exclusive over time. Something like 90% of the Saturn’s games never left Japan, and I know there were a lot of RPGs among them.

The 7th, and especially the 8th generation of handhelds have had very JRPG-heavy libraries. Surprisingly, the Gamecube very slightly beats the PlayStation 2 here, though I’m sure the difference is within the margin of error.

Digital games didn’t exist until the 7th generation (for the purposes of this study), but there are many digital-only games now. Digital storefronts don’t stay open forever though, so it may be quite a while before the number of digital JRPGs outnumbers the physical.
This chart does not include a small number of physical Europe-exclusive releases that PriceCharting does not have.

If you remove the 50s there is some very nice symmetry here, centered around the 70s bracket.
About 83% of JRPGs score between 60 and 89.99.

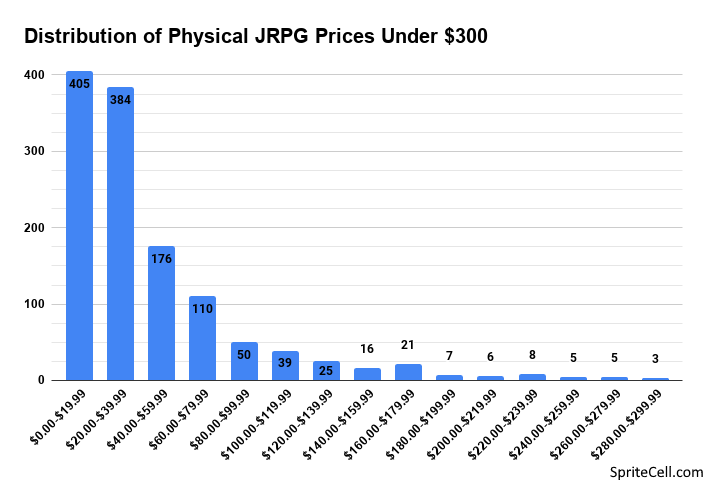
If I didn’t create a ceiling on this one, it would be unreadable and mostly full of blank columns until we get to the most expensive games.

While there are quite a few expensive JRPGs I wish I could afford, there are still over 950 that are cheaper than $60.00.

This is probably very close to the overall non-PC digital games market, not just JRPGs.
The relative lack of $25.00-$29.99 games is interesting.
Summon Night 6: Lost Borders is the only JRPG that costs $54.99.

Trivia and Superlatives

The games included in this study fit a common definition of JRPGs, but are not an objective truth. I make this distinction because I want any readers of this project to exercise some caution before repeating any of the following as an absolute fact. And so I don’t have to add “for the purposes of this study” over and over to every statement.

I learned a lot about my favorite genre and still have more interesting information to share.

One interesting JRPG I didn’t get to talk about was Napoleon. Napoleon was only released in Japan and France, possibly the only game to ever have this distinction. I specifically didn’t make “available in English” a requirement so that it would be included.

I recorded the range of metascores of every JRPG series, too. Dark Souls unsurprisingly had the smallest range, at 8.06, but Etrian Odyssey was #2 with 9.45. On the other side of the scale Final Fantasy had the largest range thanks to its many spinoffs, at 45.46. Atelier has the second highest range thanks to the poorly received Mana Khemia: Student Alliance, at 41.22.

The cheapest JRPG with a metascore of over 90 is Final Fantasy XII for the PlayStation 2, just $6.40.

The first 5 JRPGs released in North America or Europe – remember that these dates are not exact, and are in a mm/dd/yyyy format:

  • Miracle Warriors: Seal of the Dark Lord – 01/31/1988 – Master System
  • Dragon Power – 03/01/1988 – NES
  • Phantasy Star – 11/01/1988 – Master System
  • Castlevania II: Simon’s Quest – 12/01/1988 – NES
  • Zelda II: The Adventure of Link – 12/01/1988 – NES

The oldest JRPG still exclusive to one system is SpellCaster on the Master System, released 09/01/89. The first digital-only JRPG was Ape Quest for the PSP (01/10/08), though it did get a physical release in Japan.

The 5 JRPGs with the lowest metascores:

  • Magus (PlayStation 3) – 32.5
  • Fantasy Hero: Unsigned Legacy (Switch) – 34
  • Swords & Darkness (3DS) – 36
  • Arc of Alchemist (Switch) – 36
  • Medabots Infinity (GameCube) – 37.67

The 10 JRPGs with the highest metascores:

  • Chrono Trigger (SNES) – 95.64
  • Persona 5 Royal (PlayStation 4) – 95
  • Persona 4: Golden (PSVita) – 94.16
  • Final Fantasy III (what we know as VI now, SNES) – 93.96
  • Persona 5 (PlayStation 4) – 93.3
  • Castlevania: Symphony of the Night (PlayStation) – 93.03
  • Odin Sphere: Leifthrasir (PlayStation Vita) – 93
  • Dragon Quest XI S: Echoes of an Elusive Age – Definitive Edition (PlayStation 4) – 93
  • Final Fantasy IX (PlayStation) – 92.72
  • Fire Emblem: Awakening (3DS) – 92.52

The earliest game to earn any poll points was Phantasy Star for the Sega Master System, released around 11/01/1988.

The 10 JRPGs with the most poll points:

  • Chrono Trigger (SNES, DS) – 100 poll points
  • Persona 5 (PlayStation 3, PlayStation 4) – 78.33 poll points
  • Final Fantasy III/Final Fantasy VI (SNES, DS) – 65.89 poll points
  • Shin Megami Tensei: Persona 4/Persona 4: Golden (PlayStation 2, PlayStation Vita) – 59.60 poll points
  • Final Fantasy X (PlayStation 2) – 56.03 poll points
  • Final Fantasy IX (PlayStation, PlayStation 4, Switch, Xbox One) – 53.34 poll points
  • Dragon Quest XI S: Echoes of an Elusive Age – Definitive Edition (PlayStation 4, Switch, Xbox One) – 51.35 poll points
  • Shin Megami Tensei: Persona 3 Portable (PlayStation Portable) – 48.61 poll points
  • Nier: Automata (PlayStation 4, Xbox One) – 48.20 poll points
  • Xenoblade Chronicles/Xenoblade Chronicles Definitive Edition (Wii, Switch) 43.26 poll points

The 5 cheapest JRPGs (complete, physical):

  • Kingdom of Paradise (PlayStation Portable) – $3.75
  • Sushi Striker (3DS) – $4.39
  • Code Name: S.T.E.A.M. (3DS) – $4.47
  • Dragon’s Dogma (Xbox 360) – $4.60
  • Tokyo Twilight Ghost Hunters – Daybreak Special Gigs (PlayStation 4) – $4.90

The 5 most expensive JRPGs (complete, physical):

  • Earthbound (SNES) – $1,275.78
  • Panzer Dragoon Saga (Saturn) – $996.61
  • Magic Knight Rayearth (Saturn) – $742.50
  • E.V.O.: Search for Eden (SNES) – $624.99
  • Chrono Trigger (SNES) – $546.93

I should have made this a graph, but the most to least expensive average price of a physical game by system:

  • Saturn: $300.21
  • 3DO: $196.87
  • SNES: $192.38
  • Sega CD: $175.05
  • Turbografx: $155.60
  • Game Boy: $140.36
  • N64: $125.70
  • Game Boy Color: $93.55
  • NES: $87.76
  • Gamecube: $85.31
  • Game Boy Advance: $82.17
  • PlayStation: $77.28
  • Genesis: $72.70
  • Game Gear: $62.96
  • Master System: $55.48
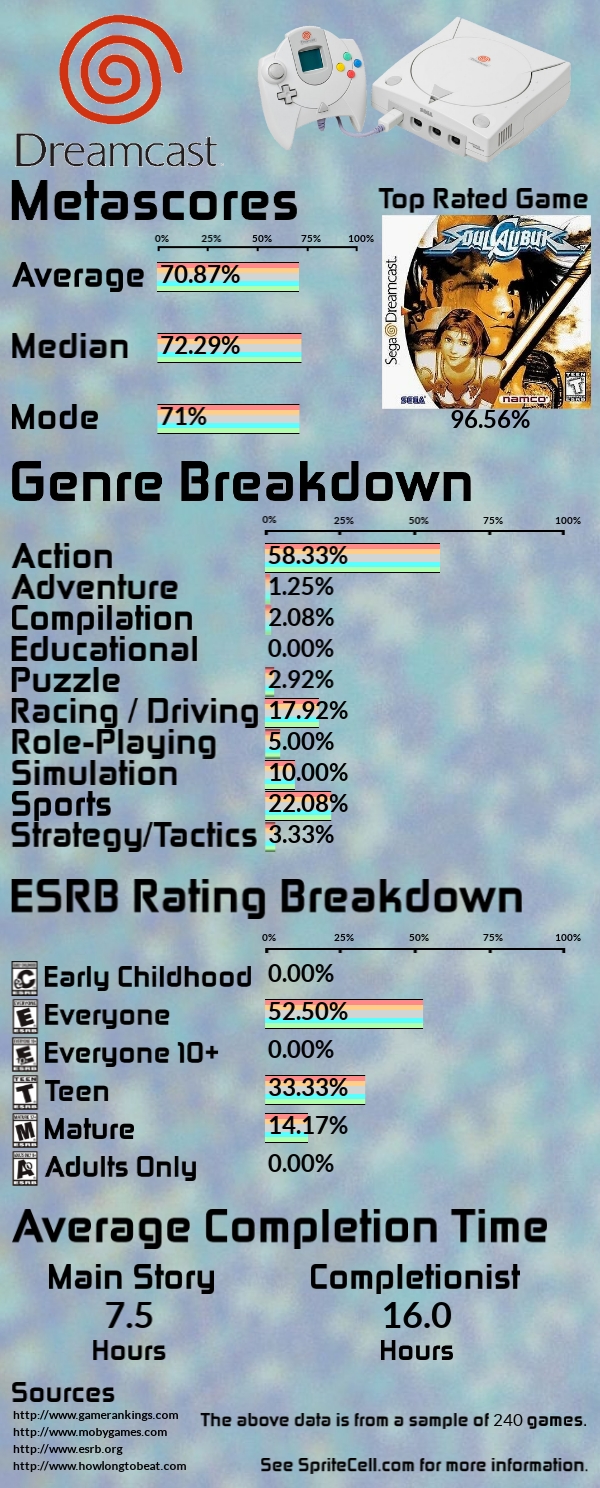
  • Dreamcast: $46.18
  • DS: $46.00
  • PlayStation 2: $37.63
  • Wii: $33.13
  • Switch: $26.24
  • PlayStation Vita: $22.96
  • PlayStation 4: $22.87
  • Wii U: $21.06
  • Xbox One: $18.56
  • PlayStation 3: $18.56
  • 3DS: $17.65
  • PlayStation Portable: $17.20
  • Xbox: $13.95
  • Xbox 360: $13.77

The overall average was $41.67, in between the DS and PlayStation 2.

The Best JRPG System

Back to the central question of this study, first let us discuss individual systems and just their libraries, without backwards compatibility.

I have to give it to the PlayStation 4. It has the most JRPGs scoring at least 80 by a good margin, has a large and diverse library, it’s modern enough to not have the headaches of battery or memory card saves, it has online features, and it has trophy support if you’re into that. The games are also cheaper on average than the Switch, and will likely fall much more over the next ten years.

The 3DS and Switch are also excellent systems, with lots of highly rated games, and are handhelds/can be handheld. The 3DS has cheaper games on average (4th cheapest average physical price), while the Switch has a more eclectic selection of ports from different eras, but fewer exclusives.

If we’re to include backwards compatibility I think a “fat” PlayStation 3 that can play PlayStation 2 and PlayStation discs offers the best overall value with a huge and mostly affordable library. Unfortunately, finding one in working condition is becoming harder and more expensive. While a fix for the Yellow Ring of Death has fairly recently come to light, it still requires buying specific capacitors and a willingness to open up your system and solder. In addition there are quite a few PS one Classics and PlayStation 2 Classics if you want cheap digital JRPGs.

If you’re not willing to do hardware fixes or you’re not looking to buy digital games, the PlayStation 2 and non-fat PlayStation 3 both play original PlayStation discs natively, which is a nice if expensive addition to their libraries.

The 3DS, which can play DS games, is another excellent choice, with a large number of JRPGs that are unlikely to ever get ported elsewhere, and overall cheap prices with a few expensive outliers.

If you are into older handheld JRPGs, the GameCube with a Game Boy Player is actually capable of playing games from the entire Game Boy line. Those 4 systems are among the 11 most expensive systems to buy JRPGs for, so it’s not for everyone.

So overall, depending on your tastes and wallet, the PlayStation 4, PlayStation 3, PlayStation 2, Switch, and 3DS are all great systems with lots of quality JRPGs to play, many of which are quite affordable.

Wrapup

After reading all this did you change your mind at all? What do you value most when considering a JRPG system? Should cost be a factor at all? Is library size the only important metric? Or maybe you only care about your favorite series?

I would like to include a copy of the spreadsheet I used to make this project. Perhaps you will find it helpful in finding a new JRPG to play or perhaps you would like to study the statistics your own way. You can save this as an HTML file and then copy and paste into your preferred spreadsheet program. Some of the formatting is sloppy and I am sure I made some mistakes.

https://docs.google.com/spreadsheets/d/e/2PACX-1vRivdWr57EDcnjZLQSfPzZI3Z9pJ0urTARI9ErGF-z3zPjUvGqq5Sh5gKqOfLEo6dlnYWS-jTSO5PPZ/pubhtml

Sources

The JRPG Index, by Lucca, part of JRPG Chronicles, for the base list of games.

/r/JRPG wiki’s list of JRPGs for a lot of publisher and release date information.

Wikipedia’s various lists of games for publisher, release date, and other information.

https://gr.blade.sk/#/ for an archive of GameRankings’s metascores.

MetaCritic for other metascores.

/r/JRPG’s Greatest JRPGs of All-Time poll results for providing poll numbers.

The Greatest JRPG Games and Battle Systems of All Time Poll for also providing poll numbers.

PriceCharting for physical game prices.

Nintendo Game Store for digital prices of Nintendo games.

Official PlayStation Store for digital prices of Sony games.

Microsoft Store for digital prices of Microsoft games.

MobyGames for exclusivity and miscellaneous information.


More content

The first part of this project has some important context about how this study was conducted.

I realized I had a lot of data I could find that wouldn’t really make for a good graph, and some trivia that didn’t fit anywhere. This is a more loosely structured post, so please forgive the abrupt changes of subject.

More on Metascores

The day with the most games released with a 90+ metascore was, well, a two way tie.

  • February 29th, 2000
    • Dead Or Alive 2 (Dreamcast)
    • Tony Hawk’s Pro Skater (N64)
    • Rayman 2: The Great Escape (Dreamcast)
    • Resident Evil: Code Veronica (Dreamcast)
  • November 18th, 2001
    • Star Wars Rogue Squadron II: Rogue Leader (Gamecube)
    • Madden NFL 2002 (Gamecube)
    • IL2-Sturmovik (PC)
    • Tony Hawk’s Pro Skater 3 (Gamecube)

Great days for Dreamcast and Gamecube. Wow, Dreamcast had 7 games release on Leap Day, and Chu Chu Rocket was pretty close to the 90+ club.

The greatest drought between games with a 90+ metascore was… ok, I was going to say between Realms of the Haunting and Dungeon Keeper, but in double checking I have now found 3 possible release dates for Realms and the one I have recorded is probably wrong.

Let’s instead go with Out of the Park Baseball (3/23/06) and Company of Heroes (9/13/06), a period of 174 days. Remember how 2006 saw that dip in metascores?

Two games, one name, two developers, one score.

More on Descriptors

Are you ready for more content descriptor details? The game with the most descriptors I could find was 9, and it’s not something you would expect:

I didn’t get into this before, but the ESRB combines substance descriptors if they’re both “use” or both “reference” for some reason. Not sure any game has all three. That was a bit of a pain to deal with.

Anyway, I have no idea why this singing game has so many, and oddly enough the Switch version only has 8, no Partial Nudity.

Several other games had 8 descriptors, most are current generation:

  • Constructor Plus (Switch, 3DS, PS4)
    • Blood, Crude Humor, Drug Reference, Language, Suggestive Themes, Use of Alcohol, Use of Tobacco, Violence
  • Constructor HD (Xbox One, PS4)
    • Blood, Crude Humor, Drug Reference, Language, Suggestive Themes, Use of Alcohol, Use of Tobacco, Violence
  • Night in the Woods (Switch, PS4, Xbox One, PC)
    • Fantasy Violence, Mild Blood, Sexual Themes, Drug Reference, Language, Crude Humor, Use of Alcohol, Use of Tobacco
  • The Red Strings Club (Switch)
    • Blood, Drug Reference, Nudity, Strong Language, Suggestive Themes, Use of Alcohol, Use of Tobacco, Violence
  • Thimbleweed Park (Switch, PS4, Xbox One, PC)
    • Crude Humor, Drug Reference, Language, MildBlooo, MildVio, Sexual Themes, Use of Alcohol, Use of Tobacco
  • Def Jam Rapstar (Wii, PS3, Xbox 360)
    • Drug Reference, Mild Blood, Mild Violence, Partial Nudity, Sexual Themes, Strong Lyrics, Use of Alcohol, Use of Tobacco
  • Grand Theft Auto V (PS3, PS4, Xbox 360, Xbox One, PC)
    • Blood and Gore, Intense Violence, Mature Humor, Nudity, Strong Language, Strong Sexual Content, Use of Drugs, Use of Alcohol
  • Duke Nukem Forever (PS3, Xbox 360, PC)
    • Blood and Gore, Intense Violence, Mature Humor, Nudity, Strong Language, Strong Sexual Content, Use of Drugs, Use of Alcohol
  • Skylight Freerange (Vita)
    • Violence, Blood, Sexual Themes, Nudity, Drug Reference, Strong Language, Use of Alcohol, Use of Tobacco
  • Skylight Freerange 2 (Vita)
    • Violence, Blood, Sexual Themes, Nudity, Drug Reference, Strong Language, Use of Alcohol, Use of Tobacco

The only game with both Mild Fantasy Violence and Mild Cartoon Violence was Xbox Live Arcade Unplugged Vol. 1. Okay, a compilation, but it doesn’t seem like there should be a reason those don’t ever appear together otherwise.

The only game with Nudity and Simulating Gambling was Dead or Alive Xtreme Beach Volleyball.

I had to check the box to make sure it wasn’t an error on the ESRB website. But yes, Loons has two degrees of violence. I don’t think any other game I looked at had two “tiers” of something. I have to imagine it was a mistake.

Is there any actual content differences between these versions? I believe the Vita version was released before the “rate it yourself for cheaper” program.

I’m again not familiar with these two games, but could the Cartoon Violence really be significantly more major in one version? Usually when a game is released on multiple platforms, even months apart, it gets one entry if they have the same content. Maybe for some reason different people handled these two and had different opinions?

Fantasy Violence wasn’t a descriptor when the original was released, so fair enough there, but that is quite a difference in descriptors.


More on the ESRB Website and ESRB Weirdness

This game was known as Speedster in Europe, and Rush Hour in North America. Why does a North American rating system website have the European title at all? This was the only two name case like this I came across.

Released on “Nintendo”, I came across a few of those.

I was pretty confused by this when I saw it, but I found an article where the creator discusses what and why he tones down the Wii U version.

Should a crossword game where the clues are a bit off-color (this actually sounds extreme for a newspaper puzzle) count as much as if there were actual characters engaging in these acts? It’s a bit of an edge case. It’s also funny that they censored “ass” on this website aimed at adult parents.

The ESRB’s website will ignore spaces when searching titles. Finding the rating of a Playstation game called “One” was quite an experience. It was on something like the 37th page (results are chronological) and you can only go forward one page at a time. You can filter by system, but only for some newer systems because why would would anyone care about something old.

If you were wondering why I didn’t just look at a picture of One’s case on eBay, I did. Games are supposed to list their descriptors on the back, below the ESRB rating, but this one didn’t.

This My Little Pony game doesn’t have any ESRB information at all on the back. I can’t find much information about game box art requirements, like what size things have to be, where they need to be placed, just “in June 2003 — the ESRB announced new labeling procedures (requiring the prominent display of back-of-the-box information)“, which is odd since the overwhelming majority of games already had that. I suppose publishers handle box art, but there is still enough structure to them that they must have a lot of requirements.

After a bit of browsing, I found this E.T. game for Game Boy Advance without any ESRB information on the back.

The Best, worst and Most Average game

I realized that with all of the data I have that I can construct what would theoretically be the best and worst game possible, based on averages. This is a for fun exercise, please don’t take it too seriously.

The worst possible game, based on average metascores:

  • System: Wii
  • Release Date: August 4th, 2007
  • Genre: Educational
  • ESRB Rating: Everyone (Early Childhood games don’t even get ratings so I won’t assume)
  • ESRB Content Descriptors: None
  • Length: As short as possible, definitely less than 4.5 hours to beat

The best possible game, based on average metascores:

  • System: Xbox One
  • Release Date: December 28, 2019
  • Genre: Role-Playing and Compilation
  • ESRB Rating: Mature
  • ESRB Content Descriptors: Sexual Content, Nudity, Use of Tobacco, Use of Alcohol, Use of Drugs, Intense Violence, Blood and Gore
  • Length: As long as possible, at least 15 hours to beat

That best possible game sounds a bit like a Mass Effect trilogy compilation, which has been rumored as of this writing (May 9th).

Most average game, based on average metascores:

  • System: Game Boy Color
  • Release Date: February 3, 2010
  • Genre: Simulation
  • ESRB Rating: E10+
  • ESRB Content Descriptors: Crude Humor
  • Length: 7.5 hours to beat

Ignoring system, but considering proximity to the actual average score of 70.25, we might label The Urbz: Sims in the City to be the most average game of the past 25 years. It doesn’t quite fit every parameter, but nothing will. I’m sure there’s better ways of finding “most average” than looking at what parameters line up in the middle of metascores, too.

That’s all for the 25 year project. Is there a specific thing that I could find quickly with the information I have that you’re curious about?

Sources

GameRankings.com for metascores and some release dates. Archives: 1, 2, 3

MobyGames.com for genres, some release dates, some ESRB ratings, and some ESRB content descriptors

HowLongToBeat.com for main story and completionist times.

ESRB.org for ESRB ratings and ESRB content descriptors

Wikipedia for its many lists of games

Content Descriptors Background

The first part of this project has some important context about how this study was conducted.

The ESRB does not just give games ratings, it also uses content descriptors to more specifically describe content that consumers may find objectionable. Very similar, appearing in the same place as content descriptors on the back of game boxes, are also “Interactive Elements” that describe online features that consumers may want to know about before buying a game, such as In-Game Purchases or Shares Location. I did not include interactive elements in this study.

I find these content descriptors so interesting for two reasons. One, because it’s a look at how an organization tries to organize and sort thousands of games based largely on what parents might not want their children to be exposed to, and two, because it’s a formal description of what kind things happen inside a game. No one else is going to make a list of games that have “Cartoon Violence, but it’s pretty mild” but a ratings agency.

By my count there have been 49 content descriptors used during the life of the ESRB. Several have been retired. A couple seem to be “retired” in that they have been replaced with other descriptors but have been used a few times since their retirement, perhaps in error. Two, as far as I can tell, have never been used.

Some Adult Assistance May Be Needed shows up on many lists of content descriptors, including Wikipedia’s, but does not appear on the ESRB’s list of descriptors, though presumably it did at some point. These lists say that it is exclusive to Early Childhood games. MobyGames claims a single game has received this descriptor, Disney’s Little Einsteins. This game is rated Everyone, not Early Childhood. The ESRB’s page for the game says it has no descriptors. GameFAQ’s scans of the box also show no descriptors.

Real Gambling, used for games where real money is exchanged while gambling, is listed on the ESRB’s list of descriptors, but I can find no evidence it has ever been used. You may be aware that Peak Entertainment Casinos is the only game to receive an Adults Only rating for having real gambling, and that is true. However, it has the content descriptor “Gambling”, a descriptor that was retired, seemingly split into Simulated Gambling and Real Gambling. The Gambling descriptor was also used for Dead or Alive Xtreme Beach Volleyball, which only features gambling for in-game currency.

There are many descriptors with “mild” prefixes, but the ESRB does not acknowledge these as separate descriptors from the non-prefixed versions (except for the substance ones, which are worded differently), on their website, but do list the “strong” prefixed versions.

The ESRB categorizes content descriptors, but I did not realize this before I had already categorized them myself. The only difference ended up being that I put blood and violence in the same category, and I included retired descriptors.

ESRB Content Descriptors – Distribution

I’m starting with this mammoth chart so I can list all of the descriptors and their approximate dates of use. You’ll notice some descriptors used once or twice and then not used for years before being used regularly, like Tobacco Reference appearing in one game, 4 years before any other substance reference descriptor appeared.

I looked it up and that game was Commandos: Beyond the Call of Duty (an expansion pack, but a standalone one, so it counts). If you go to ESRB.org (where I got most of my ESRB information) and search for that game, you’ll see this:

But if you go to Steam, where it is currently for sale, you’ll see this:

So, which is correct? The Steam listing has “Animated Violence”, one of those “retired but not” descriptors, which makes it look much older than the ESRB one. It’s possible Steam used the game’s old, original ESRB rating for some reason (the back of the box seems to confirm this was the original rating), and then the game got re-rated by the ESRB some time later. Why would the game get re-rated if if not for the Steam release, though?

I spent at least 20 minutes putting together the evidence for this one specific game and I still don’t know what should “count”. The ESRB website has a lot of odd conflicting information and I didn’t have the will to double check and investigate every single one.

Furthering my point that it’s very hard to determine the history of descriptors let’s look at MobyGame’s list of games with Animated Violence. One game in 2018, one in 2011, a handful until 2003, and then dozens every year before that. The ESRB’s content descriptor list in February 2004 doesn’t mention it, but a list from February 2001 has it under “discontinued content descriptors”. And yet that MobyGames list has dozens of uses of the descriptor in 2001 and 2002! And looking at that ESRB page from 2001 page I am seeing for the first time the descriptor “Reading Skills, Fine Motor Skills, Higher-Level Thinking Skills”. Searching for that exact phrase in Google right now returns 25 results, all pretty much verbatim copies of that outdated list, no games mentioned as using it, so I guess that’s three never used descriptors. No one has found it interesting enough to discuss until now, either. I have really been down a rabbit hole on this subject.

So, as I discuss when these descriptors began and ended I will be ignoring some outliers. If nothing is stated, then the descriptor has been in continuous use since the start of this study, in 1995.

  • Substances
    • Alcohol Reference – Started in 2003 with the other [Substance] Reference descriptors
    • Use of Alcohol
    • Drug Reference – Started in 2003 with the other [Substance] Reference descriptors
    • Use of Drugs – Started in 2002, it seems odd it took longer than Alcohol and Tobacco.
    • Tobacco Reference – Started in 2003 with the other [Substance] Reference descriptors
    • Use of Tobacco
  • Violence
    • Animated Blood – Animated in these descriptors means “cartoony”, not that it is moving.
    • Animated Blood and Gore – Probably meant to be retired in 2002, but has popped up once in a while since then.
    • Mild Animated Violence – Probably meant to be retired in 2002, but has popped up once in a while since then.
    • Animated Violence – Probably meant to be retired in 2002, but has popped up once in a while since then.
    • Mild Blood – Probably started in 2006, that was the first year I have with more than one use.
    • Blood – Started in 1997, or I just got very unlucky with my small number of games from 1995 and 1996.
    • Realistic Blood – Stopped being seen after 2000, the other “Realistic” descriptors were last seen in 2001.
    • Blood and Gore
    • Realistic Blood and Gore – This may have been intended as a stronger version of Blood and Gore because they coexisted, but last seen in 2001.
    • Mild Cartoon Violence – Started 2003.
    • Cartoon Violence – Started 2003. One of “4” (they didn’t include mild versions as separate, so it should be 6) new descriptors announced in June 2003.
    • Mild Fantasy Violence – Started 2003.
    • Fantasy Violence – One of the “4” new descriptors announced in June 2003. I have several from before then, somehow.
    • Intense Violence – One of the “4” new descriptors announced in June 2003.
    • Mild Realistic Violence – Discontinued in 1996 or 1999.
    • Realistic Violence – Gone after 2001.
    • Mild Violence
    • Violence
    • Violent References – Began in 2007.
  • Humor and Mischief
    • Comic Mischief
    • Crude Humor – Probably started use in 2003, although never got a press release like the “4” did.
    • Mature Humor – Probably started use in 2003. Likely a “Strong” version of Crude Humor as we’ll see later.
  • Educational
    • Edutainment – Last seen in 2008.
    • Informational – Last seen 2001.
  • Gambling
    • Simulated Gambling – Started in 2004.
    • Gambling – In use 2000-2004, probably split into Simulated Gambling and the never seen Real Gambling.
    • Gaming – Last seen 2000. Seems to have been replaced with the short lived Gambling. This word is occasionally used as a way to say “gambling” but feels a bit old fashioned, perhaps due to the rise of video and computer games.
  • Language
    • Mild Language
    • Language – Either started in 1998, or I got unlucky with my sample. MobyGame’s list makes it look like it may have indeed started then. It would be odd if it was introduced after its Mild and Strong versions.
    • Strong Language
    • Mild Lyrics – Introduced in 2001.
    • Lyrics – Seemingly introduced in 2004, also after its Mild and Strong versions.
    • Strong Lyrics – Introduced in 2001.
  • Sexual Content
    • Partial Nudity – First used 2001, maybe 2002.
    • Nudity – First used 2002.
    • Sexual Content – First used 2008, or maybe 2006.
    • Strong Sexual Content – Probably around for 25+ years. Oddly, I have no 2019 games with this after a 17 year run.
    • Mild Sexual Themes – Introduced 2008, significantly after its non-prefixed version.
    • Sexual Themes – I’m inclined to think this started in 2004, if not then it’s an odd case of a descriptor suddenly rocketing up in use.
    • Mature Sexual Themes – Last used 2004. It’s possible this was replaced with Sexual Themes, which seems like maybe a way to downplay it.
    • Sexual Violence – This is so rare it’s hard to say. Only seen in 2014. In fact, it was only seen in one game in this study, which was ported to 4 systems: Metal Gear Solid V: Ground Zeroes.
    • Mild Suggestive Themes – Began use in 2004.
    • Suggestive Themes

Alright, now I can get to the graphs I usually start with. Please note the Y-axis of these graphs, some categories of descriptors are much more common than others. Alcohol is the most common substance overall and drugs the least. There seems to be more and more smoking in video games over time, quite the opposite of the movie industry.

It’s odd how Animated Violence was semi-retired just as Violence took off (but it did already exist). They are distinct things so it wasn’t a replacement.

A sharp decline in Comic Mischief after a huge spike. I have to wonder how the raters are trained on this kind of thing, do they just read a list of descriptors? Has the public perception of what is Comic Mischief changed over time, or have game developers decided to employ it less than a tenth as often as they did a decade ago?

Two very rarely used descriptors that haven’t been seen in a long time. Informational is an odd one, it was for games with reference material, data, that kind of thing. The only games I have using it were Need for Speed: Porsche Unleashed, Virtual Kasparaov, Timeline, and Timescape: Journey to Pompeii.

It took a few tries, but the ESRB eventually decided what term to use. Gambling is pretty low overall, perhaps PEGI (the European equivalent of the ESRB) standards for games with gambling influenced developers worldwide.

It took a while before technology allowed the playing of music with potentially objectionable lyrics, but it’s never been very common. I wonder if the shift towards real voice clips over text influenced the rise of bad language.

Many of these descriptors sound similar. Aren’t they all “Sexual Content”, why is that a separate descriptor? This article is a good overview of how all of these differ. Mild Suggestive Themes was sure big for a while, but then drastically fell in use.

I see now that the long bar graph is missing Alcohol Reference, sorry about that. Violence is by far the most common descriptor used, with Blood at #2 with just over half as many uses . Four ports of Metal Gear Solid V: Ground Zeroes makes Sexual Violence the second rarest descriptor. But the rarest, Mild Realistic Violence, was only seen in Noir: A Shadowy Thriller and Professional Bull Rider.

Overall, all kinds of violence dominate games.


Here is how common every combination of descriptors is. The white cells are the overall percent of games that have that descriptor, and then the pink cells at the bottom are what percent of games have that descriptor as their sole descriptor.

It’s safe to say that games have added more and more things to warn about over time, but the ESRB has also expanded what kinds of things they have descriptors for over time. Referring to substance use wasn’t deemed worthy of note until 2003, for instance. I’m sure a number of games released before then would have qualified.

This graph fits pretty well with the general trends of more descriptors over time, and how descriptors relate to ESRB ratings, which we’ll look at later.

ESRB Content Descriptors + Metascores

The better a game is, the more content descriptors it has on average, with quite a jump in the highest tier. Do you think people are more satisfied the more realistic the violence, the more graphic the sexual content?

Games with Sexual Content are more liked than games with any other descriptor. Yet Strong Sexual Content doesn’t do quite as well. Sex in general is a pretty strong indicator of quality, remember that the overall metascore average is 70.25, every sex descriptor is above that. The three substance use descriptors are very close in scores and above average, but merely referring to those same substances scores several fewer metascore points.

Simulated Gambling, perhaps an in-game casino, really seems to turn off reviewers. Cartoon Violence may be so low due to being common in cheap licensed games or just kiddie fare in general. Referring to violence is evidently less satisfying than seeing it.

ESRB Content Descriptors + Genres

In some genres a substance will be alluded to more often than used, and in other genres it’s the other way around. Makes sense for the narrative genres to have more substance descriptors in general.

Role-Playing heavily favors Fantasy Violence due to usually being have some kind of magical or supernatural combat. Compilations have the most Cartoon Violence for some reason.

Again, please note the Y-axis on these graphs will change. Action really favors Crude Humor over Comic Mischief. Not a single Educational, Puzzle, or Simulation game had Mature Humor.

No surprise that Educational games have educational descriptors.

It’s odd that a genre as general as Action is so low in gambling compared to others. I don’t associate Compilations with gambling, I have no idea why that is so high.

The lyrics descriptors more or less work as an indication of how much English language licensed music appears in games, very rarely in Role-Playing, but fairly often in Sports. Simulation includes the likes of Rock Band, so that’s why it has such a showing for lyrical content.

I’m baffled as to why Racing / Driving has the highest rates of Nudity. Role-Playing games overall rank pretty high when it comes to sexual descriptors, while Educational, Puzzle, and Sports games are decidedly unsexy.

Role-Playing attracts a lot of potential content descriptors, Compilation’s high number makes sense, every game can add a few more.

All that Genre + Descriptor data in a chart.

ESRB Content Descriptors + Game Lengths

The longer a game is the more descriptors it has on average.

ESRB Content Descriptors + ESRb Ratings


The two (of 22) Early Childhood games with descriptors had Edutainment descriptors. There were only two Adults Only games included, but there’s also only a few dozen ever published. Steady increases in descriptors as rating become more severe.

Games rated Everyone rarely have any sexual or substance descriptors, and the violence tends to be fantasy or cartoon based. About 11 descriptors appear in more than 2% of E rated games.

Fantasy Violence suddenly becomes much more prevalent with E10+ games. More descriptors in general, 20 over 2%.

Violence now rockets up in use. Only slightly more descriptors used above 2% of the time, 21.

Blood and Gore and Strong Language now become much more prevalent. Only 18 descriptors used over 2% of the time. Teen games seem to employ the largest variety of descriptors, although it’s pretty close and 2% was an arbitrary cut off.

And here is how common every descriptor is with every rating. I wonder if the ESRB has hard rules for which descriptors can be used with which ratings. It would make sense for a game with Use of Drugs to not be allowed less than a Teen rating, but is there a rule against Mild Fantasy Violence in a Mature rated game, or has there just not been any (any in this study, at least) games that have done that?

And that’s all my graphs and charts for content descriptors. There will be one more bonus post before the next project. It will have some trivia and odd things I found in the course of making all this.

Sources

GameRankings.com for metascores and some release dates. Archives: 1, 2, 3

MobyGames.com for genres, some release dates, some ESRB ratings, and some ESRB content descriptors

HowLongToBeat.com for main story and completionist times.

ESRB.org for ESRB ratings and ESRB content descriptors

Wikipedia for its many lists of games

System Infographics

The first part of this project has some important context about how this study was conducted.

As a bonus today I have system infographics summarizing some of the information I’ve gone over so far. It’s nice to directly compare systems on a variety of statistics.

There is some important information about how these numbers were obtained in the other parts of this project, please see Part 1 if you haven’t already.

Nintendo Systems

Sony Systems

Sega Systems

Microsoft Systems

Personal Computer

Sources

GameRankings.com for metascores and some release dates. Archives: 1, 2, 3

MobyGames.com for genres, some release dates, some ESRB ratings, and some ESRB content descriptors

HowLongToBeat.com for main story and completionist times.

ESRB.org for ESRB ratings and ESRB content descriptors

Wikipedia for its many lists of games

ESRB Ratings Background

The first part of this project has some important context about how this study was conducted.

The Entertainment Software Rating Board gives content ratings to games and is recognized in the United States, Canada, and Mexico. The first games to receive ratings were released midway into the 4th generation in September 1994 and included Pitfall: The Mayan Adventure, Sonic Triple Trouble, Super Punch Out!!, Donkey Kong Country, and Doom (32X). The data we’re looking at starts at the fifth generation, so most of the ESRB’s history is included.

The following summaries of the ESRB ratings are based on the ESRB’s descriptions of them, the content descriptors post will go into more detail:

Early Childhood was aimed at young children and was mostly educational games. This rating was retired in 2018 with no announcement until the ESRB replied to a tweet asking about it in 2019. I find it interesting and odd that there being few eC games would be a reason to ditch a useful label. These games had no objectionable content and can only have a small number of content descriptors, I found one used on two games in this study.

The ESRB removed any mention of this rating from their rating description page. In fact, they removed the image of the rating from their website completely:

I took that screen capture several months ago and I was double checking a few things while writing this and it now seems to be impossible to find Early Childhood games by searching the ESRB website:

But they can still be found with a google search, although there’s just a blank space now instead of a broken image:

Everyone was known as “Kids to Adults” until 1998. These games can have only mildly objectionable content such as mild language or violence. Some games rated Everyone have content descriptors, some do not.

Everyone 10+ was introduced in March 2005 as a rating for games in between Everyone and Teen and suitable for players at least 10 years old. All E10+ games have at least one content descriptor.

Some games that got re-rated later were changed from E or T to E10+:

Teen rated games are intended for audiences at least 13 years old. Games with this rating may include simulated gambling or some blood. All Teen games have at least one content descriptor.

Mature rated games are intended for ages 17 and up. They can include intense and realistic violence, language, and sexual content and they all have at least one content descriptor.

Adults Only rated games are for those 18 and up. Games with this rating can have extreme violence, graphic sexual content, and gambling with real money (Peak Entertainment Casinos is the only game to have received this rating for gambling). The big four console manufacturers never allowed games with this rating to be released on their platform, and few retail stores will sell PC games with it, making it quite rare. Wikipedia has a nice list of these games.

ESRB Ratings Distribution

To start with here is the overall distribution of ESRB ratings. The extreme ends of the scale are quite small, but roughly 1 in 1,000 games are eC, and roughly 1 in 10,000 are Ao. Eight of the 22 eC games in this study were Sesame Street games, the two Ao games were Hatred and Seduce Me.

Games rated Everyone have only recently been overtaken by Teen games and the overall distribution of the ratings have become closer. What was it about 2001 and 2008 that kicked off a trend of games becoming less for Everyone?

This 6 year old article claims that E ratings represent 70% of all games. It seems like the source is the ESRB itself, which would probably want to paint games in a child-friendly light, but that number seems incredibly high to me. Sure, the kinds of games not included in this study might trend towards inoffensive, and there are mobile and other platforms not included here, but that still seems very high.

The N64 and Wii have the largest number of Early Childhood games, and Nintendo systems in general have more games on the child-friendly side.

The Game Boy Color has the highest percent of Everyone rated games, and at 93% this is the largest share of a rating for a system. If you don’t count the PC (and you shouldn’t, the unrated games take a chunk out of everything) the PS4 has the smallest percent.

The Wii U has the largest share of E10+ games, while the PS3 has the smallest, if you discount the systems that were out when the rating started to be used.

Meanwhile the Xbox is the most Teenage system, while the Game Boy Color is the least.

Most Mature goes to PS3, and there were zero Game Boy Color games rated Mature, and not just of games included in this study.

All two Adults Only titles included were for the PC.

Handhelds definitely get fewer games with objectionable content. For a while it certainly helped that they were less capable of rendering anything realistic, but even past that developers just don’t put those kinds of games there.

ESRB Ratings + Metascores

But what ratings do people prefer for their games? None of the Early Childhood games had metascores, and the very small sample size of two Adults Only games averaged 43.16.

Everyone, Everyone 10+, and Teen rated games are quite close, and their average, mean, and mode paint slightly different pictures. There is a small bump in metascores for Mature rated games. This may partly be because few cheaply made games are rated Mature and there is almost certainly a correlation between budget and metascore.

Mature rated games come out on top, both in overall 90+ metascores and in the percentage of games scoring that high.

ESRB Ratings + Genres

Adventure and Role-Playing, the narrative-driven genres, have the highest ratings overall. Is it harder to tell a compelling story without graphic violence, sexual situations, and bad language?

Educational, Puzzle, and Sports are all understandably low in objectionable content.

ESRB Ratings + Game Lengths

Games tend towards the Mature rated side of the scale the longer they are, although the longest main stories are a bit of an exception. Role-Playing games are such a large part of the longest buckets that their overall more adult ratings push things in that direction. Longer games also have more opportunities to present scenes that earn severe content descriptors such as Strong Language, Strong Sexual Themes, and Mature Humor.

But more on that next time, where I’ll go into more depth about content descriptors than you ever imagined possible.

Sources

GameRankings.com for metascores and some release dates. Archives: 1, 2, 3

MobyGames.com for genres, some release dates, some ESRB ratings, and some ESRB content descriptors

HowLongToBeat.com for main story and completionist times.

ESRB.org for ESRB ratings and ESRB content descriptors

Wikipedia for its many lists of games

Game Lengths Background

The first part of this project has some important context about how this study was conducted.

Today’s post is all about how long it takes to complete a game, both the main story, and to complete everything, which I will refer to as “game lengths”.

The data is from HowLongToBeat.com which takes user-submitted times which are averaged. This is the smallest data set involved in this study, only about half of the games included in the study had main story times, and about 40% had completionist times. The site also allows users to submit “Main + Extras” times in between Main Story and Completionist, which I found too vague and not very interesting. Most people aren’t submitting “I did the bare minimum” times for Main Story.

I didn’t include games that use the Solo/Co-Op/Vs. categories, which are mainly used for games that are solely PvP. There were a number of games that seem to have been given this designation in error.

There is a quirk with how HowLongToBeat.com displays information. Games under an hour long will display the number of minutes, while games an hour or longer will display X or X.5 hours. I suppose this is to make things look tidy, but it’s an unfortunate loss of detail.

Game Lengths – General

Games have gotten longer over time, but the gap between just beating the game, and doing everything the game has to offer has grown larger over time. Xbox’s achievement system debuted in 2005, while Playstation’s debuted in 2008, which may be responsible for that big completion jump in 2008. Game developers may have started designing their games with an idea in mind of long or difficult it should be to get every achievement and were afraid of making their games too short. A contributing factor may also be that people were less sure when to call a game “completed” when playing games without achievement systems.

Every game with game length data. These scatter plots give you an idea of the overall distribution of game lengths and how far the outliers are from the norm. There are so many types of games, and so many ways to play them. Less than a fourth of games make it beyond the first minor gridline of 25 and 50 hours, respectively.

I know you’re curious about those longest games. The longest main story games were 7 Football Manager games (2010-2016) at 287 to 519 hours. After that are The Secret World (281) , Destiny of Spirits (248), and Final Fantasy XIV (242).

For completion times we have Rock Band 4 on two different systems at 937 hours, followed by Dragon Quest IX (746), Animal Crossing: City Folk (690), and Gran Turismo 5 (636).

As someone that has played a lot of 3DS I never would have guessed it has the longest games on average. Sega was known for arcadey games that emphasized replaying over and over for better scores or times, so it makes sense to see Saturn and Dreamcast so short.

The structure of games can vary quite a bit, beating a fighting game’s campaign mode will almost always take under an hour, so systems with lots of fighting games may be skewed shorter, while people are likely to do many optional side quests in already long RPGs.

With these direct comparisons it we can see that handheld games don’t really have a tendency to be shorter than their console siblings, with the DS, 3DS, and PSP beating their console counterparts.

Although the trend is for games to get longer over time, the Wii is a notable example of games getting shorter compared to its predecessor, though only for main story.

Game Lengths + Metascores

I broke up the lengths of main story and completion into 4 buckets that each have approximately the same number of games.

People like long games. There may also be a correlation between game length, budget, polish and refinement.

Game Lengths + Genre

No surprise that Role-Playing comes out as the longest genre, with a big gap between main story and completion. I might have expected Strategy / Tactics to take second over the grab bag of games that make up Simulation. Despite a fair number of long visual novels Adventure comes in short due Western episodic games. It’s interesting that a Compilation of several games is still on average shorter than an individual game of several genres.


And here is how the genres are distributed in the 4 buckets. Adventure and Puzzle are the only genres that consistently become rarer as we increase time. Role-Playing really has the biggest difference between the shortest and longest bucket.

This post was a bit short, but we’re adding more and more combinations of metrics. Next time is ESRB ratings.

Sources

GameRankings.com for metascores and some release dates. Archives: 1, 2, 3

MobyGames.com for genres, some release dates, some ESRB ratings, and some ESRB content descriptors

HowLongToBeat.com for main story and completionist times.

ESRB.org for ESRB ratings and ESRB content descriptors

Wikipedia for its many lists of games

Genre Background

The first part of this project has some important context about how this study was conducted.

I searched several sites with large video game databases to decide how I was going to approach the genre section. I wasn’t totally satisfied with any of them, but I found MobyGames to be the best compromise. GameFAQs has an odd tiered system with a variable number of tiers that is inconsistent about describing certain aspects that I wouldn’t exactly call genres. GiantBomb was inconsistent and less complete. I made a list of 30ish tricky games to assign genre to and looked them up on 4 sites, and MobyGames seemed the best to me. I’m still about to point out a lot of issues, but no genre system is going to be perfect. MobyGames is also essentially a tightly controlled wiki, but things slip through the cracks and don’t get fixed, so I made changes and made things more consistent when it seemed obvious.

MobyGames has 10 genres: Action, Adventure, Compilation, Educational, Puzzle, Racing / Driving, Role-Playing (RPG), Simulation, Sports, Strategy/Tactics. That’s verbatim, and yes it drove me crazy how Racing / Driving has a space on either side of the slash, but Strategy/Tactics doesn’t, and we’re reminded how Role-Playing games are abbreviated. Games can be labeled with as many genres as needed.

Action is very general, covering fighting games, music and rhythm games, platformers, first-person shooters, and sometimes seemingly anything that isn’t turned based or menu driven. Some Sports games included it and some didn’t, confusingly. I made an effort to make it more consistent by removing it from any games that were more on the “sim” side, that weren’t arcadey or had an Actiony side mode.

Adventure, as MobyGames defines it, focuses on narrative over action, and emphasizes dialog and puzzle solving. Includes visual novels, point and clicks, walking simulators, and many games without combat.

Compilations have multiple games in one package. Does not include minigame collections like Mario Party. I removed compilation from many games that included DLC that was sold separately in a previous release, only full games put together counted for this project.

Educational doesn’t seem like it should be a genre at all to me, but these are mostly games for young children about the alphabet or basic math.

Puzzle seems to be used exclusively for games that are all about puzzles, not games that have some puzzles to solve, like the Legend of Zelda series.

Racing / Driving is included in some games with vehicular minigames or sections, like Grand Theft Auto.

Role-Playing games includes games like Dark Souls and Monster Hunter as well the The Elder Scrolls, Final Fantasy, and Persona.

Simulation for our purposes includes Cooking Mama, Nintendogs, most of the Imagine and Petz series, Phoenix Wright, and Guitar Hero. This is probably the most eclectic genre.

Sports includes wrestling, hunting, billiards, fitness, and some horse games.

Strategy/Tactics includes the Jackbox games, city builders, war games, board games, card games, and the Worms series.

Genre – General Distribution

Overall, nothing comes close to action. Yearly releases of many sports games keeps them the second most common. Role-Playing is higher than I would have expected, especially compared to Racing / Driving games.

I really like this chart, you can see how the industry has changed and how what kinds of games it makes has evolved over time. Although classic point-and-click adventures are rare now, the genre has managed to become the second largest. Some of this is because many adventure games are released episodically, and then bundled, resulting in a lot of separate game entries.

Sports games have actually become less common over time, perhaps it’s become too hard to compete with the big franchises?

PC is really an outlier here, where in other metrics it’s very close to the overall average due to making up about a fifth of the games included. It’s difficult to really see any trends among hardware companies. The time period a system exists in is probably much more important.

A bit easier to see some minimums and maximums here. Playstation Vita just barely coming out on top for RPGs. Switch really has a different makeup than other Nintendo consoles or handhelds have had. Lots of Racing / Driving games in the 5th generation. The N64 somehow has the largest percentage of Sports titles in its library.

Genre – Genre Combinations

Since games can have any number of genres, let’s look at what Action appears alongside. Not too hard to apply Action to any other genre.

Adventure games come packaged in Compilations fairly often. Almost every Adventure game released episodically eventually had a Compiled edition. I can’t think of any Racing / Driving or Sports games that were also Adventure games. Let’s see, Barbie Horse Adventures: Riding Camp is listed as Adventure and Sports, Yakuza Kiwami 1 and 2 are too (with Action as well). That’s one thing they have in common.

As said before, lots of Adventure Compilations, but a surprising number of Puzzle games in Compilations too.

There are so few Educational games that we can expect a very different graph.

“What is a Puzzle and Sports game?”, you may be asking. A few include Pocket Card Jockey, Vertigo, and Clubhouse Games.

Surprisingly few Racing / Driving games are purely their own genre. Simulation seems like a natural pairing. Racing / Driving games that are also Adventure games include Nancy Drew: The Mystery of the Clue Bender Society and L.A. Noire.

Strategy/Tactics games are a natural fit for RPG mechanics, while driving a car isn’t. I just checked and Final Fantasy XV didn’t count as a Racing / Driving game for some reason.

Simulating playing a Sport or Racing a car make sense, while other genres probably have a side mode or minigame with some kind of Simulation.

Most Sports games don’t intermingle other genres into their gameplay.

Strategy/Tactics games are often about solving the puzzle of how to win, but few are also Puzzle games.


The above graphs in chart form. Here we can see the least combination of genres is Role-Playing and Educational, which makes good sense, these genres serve very different groups and tend to have very different budgets. There were only three such games: Fossil League: Dino Tournament Challenge, Bookworm Adventures, and Bookworm Adventures: Volume 2.

Here is an overall look at what percent of games are one genre. This is different than the previous “This Genre Alone” statistics because those were only considering the subset of games with a particular genre.

Genre and Metascore

The y-axis of this graph starts at 60 to make the differences more apparent, but keep in mind the range of values is 5.13. Action is by far the most common genre, but has the second-lowest average score. Compilation’s high scores could be influenced by the perceived value of a good cost to gameplay time ratio.

And here are the the genres of the best-reviewed games. Adventure, Puzzle, Simulation, and Strategy/Tactics all pretty low considering how many games of each there are.

That’s all for genres, next time it’s completion times.

Sources

GameRankings.com for metascores and some release dates. Archives: 1, 2, 3

MobyGames.com for genres, some release dates, some ESRB ratings, and some ESRB content descriptors

HowLongToBeat.com for main story and completionist times.

ESRB.org for ESRB ratings and ESRB content descriptors

Wikipedia for its many lists of games

Introduction

This study covers 23,630 games for 21 systems and 8 metrics of information: release date, system released on, critical metascore, genre(s), length of time to beat the main story, length of time to complete everything, ESRB ratings, and ESRB content descriptors. These games were all released in North America between the second quarter of 1995 and the third quarter of 2019. The selection of games is not comprehensive of anything, it is a sample, and it is important to know how the games were chosen.

I started with games that had at least 5 critical reviews on GameRankings, a now-closed review aggregator which was similar to Metacritic, but had some great sorting options. I chose GameRankings over Metacritic  because of those sorting options and because it included older games. Although it had 4th generation games it was mostly the greatest hits of the era, so I started with 5th generation games. I included all systems from the “Big Four” (Nintendo, Sony, Sega, Microsoft) and the PC from the 5th generation to the current 8th generation. I also chose to start at the 5th generation because the ESRB didn’t start rating games until partway through the 4th generation and this way all the games included could potentially have data for each metric. For some systems I included the full list of games from wikipedia. For example, I included all 3DS games because only about 40% of its library has a metascore. For PC games I instead needed a way to cut down the number of titles, so every PC game with a GameRankings metascore was included.

All games had to have a release date, this actually disqualified some older games with unknown dates. One issue I ran into was many PC games from 1995 to 1997 supposedly had release dates on the last day of the month, way too many to be a coincidence. Multiple sources listed the same release dates, but I wasn’t able to find any information as to whether this was just when games were released at the time or if only the approximate release date is known and everyone decided to just round to the nearest last day of the month and offer no disclaimer that it is only an estimate.

All games had to have a genre. I’ll go into more detail on this later, but my genres were from MobyGames, which had genres listed for almost every game. For some of the few games without genres listed, I did my best to guess how MobyGames would have assigned it.

For games that are released on multiple platforms each occurrence is counted as a separate game. Although they are usually almost identical, exceptions do exist, and review scores are often a bit different even when games perform the same on different platforms.

All non-PC games had to have an ESRB rating. PC games were excluded because quite a few PC games, even some big exclusives, don’t have ratings. This was an issue with some obscure digital-only games, especially ones that had been removed from stores.

No expansion packs or DLC were included, unless they could be played without the base game.

So ultimately we have 23,630 games, all with release dates, genres, and systems. 17,192 have metascores, 12,652 have time to complete main story, 9,687 have completionist times, 22,651 have ESRB ratings and content descriptors.

This was a mammoth project, probably the largest I’ll ever do at once, that took over 9 months. It is complete, but it is so large (over 100 images) that I will be posting it in several chunks while I work on other projects. It will be 5 parts total (plus some bonuses) going over each metric, and also the interesting combinations.

Here is how the games included number by year. Note that this is not meant to be fully proportional to how many games were actually released each year. Some of the by-year graphs will have big swings in the first few years, this is because there weren’t many games included for those years. The Wii was released in 2006 and Steam Greenlight debuted in 2012, two platforms that attracted a lot of new developers and may be responsible for big increases in the number of games released shortly thereafter.

Metascores – General

First, let’s look at metascores. I got all of my data from GameRankings a few months before it was shut down. While I’m saddened that this easy to use site was shut down, there are some archives if you want to see it: The Internet Archive has a full copy, there is an archive website created by someone named Matúš, and they also have a google spreadsheet of all the scores.

Usually when you hear about game metascores, it is Metacritic’s metascore. GameRankings metascores were very similar, rarely ever more than 2 points different, but they included different review outlets. However, unlike Metacritic, they seem to use a straight average, rather than weighing some outlets more than others. They also give metascores with accuracy to hundredths digit.

Let’s start with the average metascore by year. A pretty steady increase in scores for over a decade. This may not be entirely about the quality of the games released, but rather have more to do with outlets reviewing fewer small digital-only titles, but this is speculation. One has to wonder what caused the 2006-2008 crater. This video of a GDC talk by EEDAR blames the Wii alone for a dip in review scores in 2006 and 2007, but their data looks a bit different than mine. This article about a reddit post focuses on 2007 and theorizes about the Wii, but also budget PS2 and DS games.

But maybe you want to argue about which system has the best games. Here we have the averages, worst rated, and best rated game for Nintendo systems. For the mode on all of these metascores I rounded the scores to the nearest whole number, otherwise you end up with the mode occuring 2 or 3 times and not having much to do with the typical game. The Wii and DS do have the lowest averages, giving some weight to them dragging down the overall average. The Wii U did better than you might expect, although there’s plenty of RCMADIAX games that weren’t included. The Switch comes out on top, a real crowd pleaser despite a glut of shovelware.

You’re probably shocked that the Sega Saturn has the highest GameRankings metascore. It’s worth an asterisk because it has the same problem as systems from the previous generation: only the cream of the crop were included. GameRankings launched in 1999, the same year as the Dreamcast was released, so they would have had to go through old magazines and website reviews to record scores, and they must have prioritized the most popular games, moreso than the N64 or PS1. In fact, there are about one ninth as many Saturn game reviews as N64. A contributing factor may also be that publications just weren’t interested in reviewing the more average Saturn games, due to its low sales in North America.

Here’s all that system data in a nice chart, including the overall. A lot of Rockstar games topping the system bests. I find it interesting how many of the worst games aren’t even famous for being bad, they were just quietly forgotten. But who could forget the classic Metal Gear Solid? For Game Boy Color. We can also see that the best selling console or handheld never has the highest average score compared to its competition.

Let’s go deeper, here’s every Nintendo system’s average metascore by quarter. Something to note is that some quarters, especially the first and the last several, only have 1-4 games, causing some large swings. That last Wii U quarter is less impressive when you consider it was solely Breath of the Wild.

There were also a few quarters with no scored games in between quarters that did have them. Lines have been connected in between data points. That said, the general trend seems to be upward, especially with the 3DS.

The PS1 has the distinction of the worst quarter ever. The only game with a GameRankings metascore for that quarter was Dragon Ball Z: Ultimate Battle 22 which got a 32.03. I apologize but in finding out that tidbit of information I see that I did not include Q2 2003 for the PS1. Three games from that period average 67.68.
These charts are fairly good at showing how system’s life spans overlap, quite a few years had three Sony systems coming out with new games worth reviewing, 2014 even had four!

The short life of the Saturn and Dreamcast can be seen here. Xbox consoles seem to have a shorter overlap than Playstation. Overall, these charts make it hard to point to any “golden age” for a system, ratings jump up and down all the time.

In case you don’t like all of those lines, here’s the full chart, with the PS1 correction. There were quite a few gaps late in the PSP’s life.

People often refer to a lack of games and a lack good games during the first part of the year. And during the summer. Here I took every game with a metascore and changed the release year to 2000 to find when the best and worst games are released throughout the year. Daily scores are all over the place, there’s not much to glean from them. 12/28 is the highest, but only 4 metascored games were released that day.

Weekly averages have more of a story to tell but still have some odd peaks and valleys. Monthly averages show a gradual rise and fall, but only vary by about 3 percent.

The raw numbers show August, September, and October as the critical highlight of the year, quickly followed by the December and January low points. Despite August’s strong performance, it has the weakest day of the whole year on the 4th. The highest rated months also seem to have daily values that are less variable.

Metascores – Specifics

Sure, 70.25 might be the overall average metascore, but how are those distributed? While scores have crept up over the years, 90+s have consistently stayed under 5%. On the other end of the scale games scoring under 60% aren’t a whole lot more common.

Percentiles are the value needed to be in the top x% percent(ile). So if you get a 95% on a test in a class of 100 students, and only one person scored better than you, you would be in the 99th percentile and the value of the 99th percentile is a score of 95. The 100th percentile is the highest score, and the 0th percentile is the lowest.

I should have reversed the order of the legend, oops. Just over an 85% metascore will put a game among the 10% highest rated. The gaps between percentiles get larger the lower you go, but overall they are pretty evenly spaced among their small range.

The standard deviation is a measure of how much values disperse (deviate) compared the average (standard). A low standard deviation means values are mostly close together, of which game metascores are an example, and they have become closer for several straight years.

You really like numbers if you look through this chart detailing the last three graphs.

Metascores – 90+

Games that score at least a 90 can be considered the very best games with cross-genre appeal that are part of the conversation about the best games of all time, classics that are discussed for many years. The number of 90+ games doesn’t follow average review scores too closely, although 2006 is still a bad year. Keep in mind I have few games from 1995-1997, I know a lot of great stuff came out then, this is not percent based at all. Even with average review scores creeping upward, the number of 90+ games has generally gone down. Do you think 2003 really had a classic coming out more than every other week on average?

Keep in mind that pre-1999 games were more likely to be included if they were the best and most famous games. 2006 is again a low point, but we can see 2011 being a turning point as well. My cutoff was before the likely highest scoring time of year for 2019, so it probably wouldn’t be as low as shown here if I included all of it.

But enough about percentages, maybe you just want to buy the system with the most high quality games available. Well, you can’t go wrong the system that has been around the longest, the PC. But to put that into perspective, if we consider the average system’s lifespan to be 6 years, then the PC has been around for 4 and one sixth system lifespans (for the purposes of this 25 year study). If we divide that 97 by 4 and one sixth, we get an average of 23.28 per system lifespan, pretty close to the Gamecube. At 5 year lifespans, 19.4.

The massive libraries of the PS2, PS3, and Xbox 360 help them achieve top status if we disregard the PC. Other than the exceptionally successful PS2 the numbers remain pretty close between Sony and Microsoft when comparing competing consoles. The Dreamcast had quite a few in its short lifetime.

That’s all for this post, next up is genres.

Sources

GameRankings.com for metascores and some release dates. Archives: 1, 2, 3

MobyGames.com for genres, some release dates, some ESRB ratings, and some ESRB content descriptors

HowLongToBeat.com for main story and completionist times.

ESRB.org for ESRB ratings and ESRB content descriptors

Wikipedia for its many lists of games


This was originally posted on reddit and I was overwhelmed with the response. So overwhelmed that I decided I wanted to do a lot more of this kind of thing. Please keep in mind that this was written in mid 2019. This post has been slightly edited.

One day I found myself wondering just how many Japanese exclusives there are and where games are being made and how it has changed over time. I really wanted to know, but I couldn’t find anything substantial. I started this project in November, 2018 and that is the cutoff, any games released after that date are not included. I made a collection of spreadsheets with every game, system, country(ies) of origin, developer(s), publisher(s), and release status among North America, Europe, and Japan. I used this data to create charts and infographics to answer my questions and look into video game history.

I stuck to Nintendo because they have a long history in games and I know them well. Even if you’re not into Nintendo, I think there is a lot of interesting information about the industry here and how it has changed since the 80s.

I know 15,000 is a suspiciously round number, but I didn’t plan it that way. After I pasted wikipedia’s lists into my spreadsheets, and added some games I found missing, it was about 15,035. I got rid of some stuff that didn’t belong, detailed below, and ended up with exactly 15,000.

What is included:
  • All officially licensed and released games on consoles and handhelds by Nintendo.

  • 64DD

  • Virtual Boy

  • Famicom Disk Drive

  • Digital-only titles, DSiWare, WiiWare

What is not included:
  • Virtual Console titles. These I considered the same thing as the original.

  • Satellaview. Many games have very incomplete information, and it’s not always clear if a game is “different enough” from its original SNES version to be considered a different game.

  • Non-games software. So no Game Boy Advance Video, Hulu app, or system settings. This also includes a few oddities like a sweater design program or 8 keys you can press to make music. I was very broad minded about this one, for example a study guide for taking a learner’s permit test for the DS said it had mini games, so I included it.

  • Games that didn’t release in North America, Europe, or Japan. There were fewer than 10 of these, but I did uncover a Hello Kitty and Bomberman game exclusive to South Korea, and some rugby/soccer and singing games exclusive to Australia. If I were to include them, I’d need release information for South Korea and Australia on every other game, and that information does not seem to exist.

  • Philips CD-i

  • Game & Watch and other miscellaneous electronic Nintendo gadgets.

Some Important Details

There are some important things to note about how I structured this data. I combined development studios and publishing companies that were owned by another company into one. For example, Ubisoft Paris and Ubisoft Barcelona are both Ubisoft studios, so they both just count as “Ubisoft”. Ubisoft bought Red Storm Entertainment in 2000, so it counts as Red Storm Entertainment before they were bought, and as Ubisoft after. Sometimes video game companies are bought by non-video game companies, I ignored these unless that company also owned at least one other video game company. For example, Atlus was bought by Index, which also owned Interchannel, so those companies were counted as Index. I counted a company as owned by another if they owned more than 50% of it, so D3 Publisher counts as Bandai Namco from the date that they acquired most of their stock.

Merged companies I counted as a new company. So Squaresoft and Enix are counted separately from Square Enix.

If a company changed their name, I used the most recent.

When games were ported, I credited the porting studio, whether that was the original creator or not. I found quite a few Switch games were handled by porting companies, but there are probably some that I missed on other systems because wikipedia is inconsistent about who gets credit.

Because of all this, some titles are credited to companies that might seem odd.

I wanted to get some stats about second parties, but that is a bit more complicated than it may seem. If you look for a list of Nintendo second parties, you will see different companies included and the likes of Intelligent Systems, Next Level Games, and HAL Laboratory. Developers that often or exclusively work with Nintendo. But most of these companies are not owned by Nintendo. Only four external studios are owned by Nintendo: Retro, 1-up, Monolith, and NDcube. I did actually make special note of these companies, they released 50 games total, on about half of Nintendo’s systems. This was pretty minor and not very interesting so I didn’t give them special sections in anything.

Sometimes companies were bought and sold and merged and went independent several times. Researching all of this took a lot of time. Have a quick look at the many Atari pages on wikipedia if you’d like to see how fun it was. I have about 10 pages of notes about company name changes and ownership.

There were also many cases of different sites having different information. On one occasion I found 5 unique developer and publisher combinations listed for a game on 5 different sites.

Some games (mainly tie ins and other very cheap stuff) will have a very obvious publisher that you can find anywhere, but the developer is unlisted. I did my best here, researching hundreds of games to try to find the company that made them. When I couldn’t find anything I credited the publisher as being the developer, which will be true in some cases and not in others. Konami and Bandai Namco seem especially likely to not credit development companies. Many of these are probably done by low profile and often anonymous outsourcing companies. You can read more about these companies here and here.

The Charts

First I’ll go through system by system, and then some charts detailing the overall progression of various things over time.

System Charts

This includes the Famicom, Famicom Disk System, and NES. Wikipedia lists them separately so I had to combine games when they were ported overseas. We can see right away that Japan dominates releases here in the 80s. Eight of the nine companies that developers or published the most games are Japanese, and most of them are still around! Most games were released in Japan and a majority were exclusive.

Nintendo’s next piece of hardware was the Game Boy. Not quite as Japan-dominated as their home console. That 7th developer is Graphic Research. Given its long life and how cheap it was to make games for, you might have expected more than 1053 games.

1751 games, a figure that would not be surpassed until digital distribution. If you’re not familiar with TOSE, here’s a quote from their wikipedia page:

“We’re always behind the scenes,” said Masa Agarida, Vice President of Tose’s U.S. division. “Our policy is not to have a vision. Instead, we follow our customers’ visions. Most of the time we refuse to put our name on the games, not even staff names.”

Many of the games they are now credited with weren’t known at release. There’s a whole wiki dedicated to finding the developers of games. That 7th developer is Telenet Japan. This is the system with the highest percentage of games available in Japan, other than the Virtual Boy.

And speaking of the Virtual Boy, here it is, the holder of many distinctions. Two of the developers, Betop and Nacoty were so obscure they have no known logos. Probably the only video game system in the world to boast more than 18% of its library consisting of bowling or Tetris games.

Other than the Virtual Boy, the N64 had a publisher controlling the highest percentage of the catalog. It’s tough when your third party support vanishes so quickly. Also other than the Virtual Boy, the smallest number of games released on a Nintendo system. Few systems are as synonymous with a single developer as the N64 is with Rare, which managed to create the 6th most games for the system, all of them pretty well regarded upon release. We see a big uptick in the percent of games released in North America here, a trend that would continue with consoles. A big drop in the percent of games developed in Japan, too.

Quite a few games were released on the Game Boy Color, even though its successor was not far away. Many of these were ports of Game Boy titles, however. Nintendo made fewer games for the GBC than any other system except the Virtual Boy. The top developers is odd mix with several companies that we won’t see in the top 7 again. Please note that the Atari in the publishers is Atari, SA, which was at the time known as Infogrames. An incredibly even distribution of games available in each region, yet so few available in all.

The Game Boy Advance saw a flood of cheap tie in games. This is also towards the end of the era where even many small budget games would get separate versions released on handhelds, made by different developers. It’s very likely that many of those Konami games were not developed by them, but by third parties who did not want to be credited.

I was pretty shocked by how many Electronic Arts games there were on Gamecube. Several yearly sports titles all hit the Gamecube while Japan largely avoided the console. Over 85% of the library was available in North America, a new high for a region (excluding the Virtual Boy). Despite their last console coming out during the same generation as the Gamecube, Sega managed to make a substantial portion of its library.

Still the Nintendo system with the most titles, the DS was a phenomenon that became the second-best selling video game system. There was a big jump here in the number of countries that developed games. Nintendo developed 65 games for the system, second only to the NES/Famicom’s 72.

Japan’s lowest share of game development yet, with a lot of North American support. Like the DS, there were a lot of new or new-to-Nintendo developers for the Wii, trying to catch the zeitgeist. Unfortunately, a lot of these titles were shovelware. High Voltage Software and Data Design Interactive don’t come close to this level of output again.

The 3DS bucks the trends and has a lot more Japanese support. One of the things I wanted to look into was the Japanese preference for handhelds and here we can see the difference it makes. Despite this, we see a lot more titles released in all regions than ever before. Four companies make their first appearance in a top 7, all Japanese.

The U.S. takes first place in development for the first and only time with the Wii U. That was largely because of RCMADIAX, who was second in development and publishing output. RCMADIAX was a one man operation that flooded the eShop with cheap, barebones games. He submitted a game for approval on the Switch but was denied and left the video game industry shortly afterward. Skunk Software was also a one-man operation. At 8.41% the Wii U had my highest unknown country of origin. There were quite a few tiny indies that never even had a website and only existed for a couple years.

Keep in mind that the Switch has several years left so its library will change, but here is where we stood in November, 2018. At roughly 1000 games every two years, the Switch should eclipse the DS in number of games eventually. You may notice that the top developers and publishers have lower percents than usual. There are tons of new studios that are making Switch games, so it’s very spread out. I had to do the most research for this system because there were so many errors on the wikipedia list. Spain is so high here because there are a lot of Spanish porting studios and lots of those medium to large indie games seem to outsource their Switch ports. We also see an unprecedented surge in all-territory releases, with very few region exclusives. Despite combining their console and handheld teams, Nintendo has thus far developed and published a smaller percent of the Switch library than any of their other systems, largely because of the huge number of titles being released.

Overall Charts


We can see that more games have been coming to more regions over time, although a varying number of games have reached Japan.

While Japan had a large chunk of the exclusives in the early days, that number has fallen greatly. Europe has never had many exclusives.

Here’s a chart with all of the available in and exclusive to numbers, but also with combinations of two regions. Japan and Europe exclusives are mostly soccer/football games.

These are the top 8 countries that have developed the most games. Every console has seen Japan’s relative output drop, though they have rallied a bit with every handheld, while it’s mostly the opposite with the United States. Gamecube’s Canada spike was because of EA Vancouver’s sports titles. From the Wii forward Europe and Australia seem to go up and down together.


Here’s a chart with every country’s percentage of games and a map of every system put together. As you can see most countries represented only worked on a handful of games, while Japan, the United States, the United Kingdom, and a few Western European countries made the bulk of games. I’d say the Game Boy Advance was the start of more countries getting involved in development.

I wanted to measure how similar the group of developers/publishers were from system to system. For instance, maybe a lot of developers were only interested in the handhelds, or maybe publishers would only touch systems that were market leaders. This is a difficult thing to measure, but I gave it a try. Please consider the results as experimental and potentially inaccurate as I am not sure my methods were sufficient. The numbers are not percents, but more like “scores” where the maximum (the exact same developers/publishers in the exact same proportions) is 100. Mostly we see that systems are most similar to systems released close in time to them, which makes sense but is not very enlightening.

I listed the top 7 of each system, but here are the top 25 overall, by number instead of percent this time. Konami’s lead will erode over time, but it will take a few generations with how long it takes to make games nowadays. TOSE is not a well-known name, but it probably worked on a fair number of games they weren’t credited for. Bandai Namco could take both second places if you add their pre-merger companies together. Sunsoft largely left video games by 2001, yet still makes both lists.

In case you wanted an even bigger list, here are the top 100. Please remember that because of the way I combined companies that some of these names will be strange. To hammer home how much cheap junk RCMADIAX pumped out, they hit the top 50 despite being active only during the Wii U.


Here are the developers that released at least one game for at least 10 systems. This time I did combine companies before they merged with their merged company. Lot of absences for the Virtual Boy, of course. Intelligent Systems will make its Switch debut very soon with Fire Emblem: Three Houses and become the only second/third party to support every Nintendo system. Kemco had a rare Virtual Boy title, but skipped the DS of all things. Konami only released Virtual Console titles for the Wii U, yet had a launch title ready for the Switch. Square had a bit of a falling out with Nintendo over the move of Final Fantasy 7 to the Playstation, which kept them away for a time, but they eventually made up.

And here are the publishers that have supported at least 10 systems. Square Enix let Nintendo publish Final Fantasy Crystal Chronicles, which keeps them from the “everything but Virtual Boy” club. Ubisoft, Electronic Arts, and Take-Two weren’t always huge publishers, but they have been releasing games on Nintendo systems for a long time.

Have you ever wondered how popular it was to put “64” in the title of N64 games? More than a fifth of them did. Seven is the least common digit in titles. Almost every game title is made up of at least two words (this is a count of titles in which a text string occurs, not a total count).

Here’s the same data grouped into themes and maybe a bit easier to read.

And finally, some miscellaneous data, like how many developers/publishers only released one game on a system, and how many games were developed by more than studio, published by more than one company, and made in more than one country. Here we see that collaborations between studios, including studios in different countries has increased over time.

Other Facts I Came Across

  • From Ubisoft Montreal’s wikipedia page: “The studio as of 2017 employs more than 3,500 staff, making it one of the largest game development studios in the world.”

  • I recorded numbers for Hong Kong separate from China, but didn’t end up using them. There were 33 games developed in Hong Kong, and 50 elsewhere in China.

  • Similarly for the UK: England 1474, Scotland 74, Wales 18, Northern Ireland 1.

  • Just Dance 2014 for the Wii and Yo-kai Watch Dance: Just Dance Special Version for Wii U both had 7 development teams listed, although these vary a bit by source.

  • The shortest game title was X for Game Boy.

  • The longest game title, which I cannot confirm is accurate, is a 3 in 1 game collection: Kunio-kun Nekketsu Collection 3 Downtown Special: Kunio-kun no Jidaigeki da yo – Zenin Shūgō! Ike Ike! Nekketsu Hockey-bu: Subete Koronde Dairantō.

  • The total developer count was 2299 when combining studios owned by companies. However, the way I structured things included these subsidiary studios separately. There were 2547 developers including them (plus a few tiny ones that I lumped together).

  • Atlus was owned by Takara (7 games), Sega Sammy (12 games), Index (17 games), and was independent (46 games) which would have been good enough for 22nd most prolific developer if combined.

  • I have 14 THQ-owned, 15 Take-Two-owned, 23 Electronic Arts-owned, and 24 Ubisoft-owned developers recorded.

  • I noticed some recurring themes in developer names. The following are the number of studios with a given string in their name. 21: 3, Infinite: 5, Planet: 5, Silicon: 6, Ninja: 8, Black: 12, Dream: 14, Pixel: 20, Star: 21.

Sources

  • Wikipedia’s lists of games was my starting point, although I had to make a lot of corrections and additions. I also visited hundreds of developer, publisher, and individual game pages.

  • Moby Games has lots of great information, including port teams, developer histories, and official website links.

  • The Giant Bomb wiki has a lot of more obscure titles and some info I couldn’t find anywhere else.

  • GameFAQs has pages for almost every obscure Japanese game.

  • RF Generation was useful for a list of eShop titles.

  • Nintendo has pages for most games released on their last few platforms.

  • Dolphin wiki for some info about Gamecube and Wii games.

  • Nintendo life for some Wii U eShop game information.

  • Youtube videos showing the splash screens as games start up.


I was really excited to do this one, I buy almost all of my games used and wanted to quantify some things people kept repeating about prices. Originally posted on reddit.

People often say that Nintendo games are more expensive, or even that they never go down in price. Sometimes people clarify that they only mean first party titles. As someone interested in collecting I’ve been curious about this for some time, so I decided to look into the average price of games on different platforms. I entered the prices of 50 games in loose, complete in box (CIB), and new condition for 19 systems, generations 5 through 8.

Since I grouped by company, here are the generations for reference:

  • 5th: N64/Playstation/Saturn
  • 6th: Gamecube/Gameboy Advance/Playstation 2/Dreamcast/Xbox
  • 7th: Wii/DS/Playstation 3/Playstation Portable/Xbox 360
  • 8th: Wii U/Switch(I guess)/3DS/Playstation 4/Vita/Xbox One

Some notes and takeaways

None of Switch’s games are even a year old yet, while most of XBone’s and PS4’s are, which is part of why its games are so expensive. I also had to include almost every physical release on the Switch, so there is some obscure stuff there.

Nintendo games are indeed more expensive on average, although I expect the gap to be smaller when the Switch is as old as the PS4, and 3DS is basically tied with the Vita.

One to two generations old seems to be the sweet spot for cheap games.

The Xbox 360 has the cheapest games on average, but Xbox, PS2, and PS3 are pretty close.

I thought first party games would be consistently more expensive than third across the board, but it was only true for Nintendo games (sans DS) and Saturn.

The Gamecube had the largest difference between first and third party prices.

Some systems had many more first party titles among the games I used than others (N64, Wii, DS), so the third party prices could be fairly different if more games were included.

New prices don’t become too crazy until 3 generations back.

Panzer Dragoon Saga was the most expensive game included – $510.1 CIB, while Madden NFL 2002 for PS2 and World Series Baseball on Xbox were the cheapest CIB at $2.78

2,850 prices were used in total for this data.

Methodology

It’s difficult to know what a good representative sample is, but I wanted to focus on games people are likely to want to buy, and cut out shovelware. First I looked for a wikipedia page like https://en.wikipedia.org/wiki/List_of_best-selling_PlayStation_4_video_games

and added the 15 best-selling. Then, I went to metacritic and added the 15 highest highest rated games that didn’t include anything I’d already added. I filled out the rest by going back and forth between these lists. For systems without a nice wikipedia list, or not featured on metacritic I googled for best of lists.

I only included games released in the U.S. with a physical release. Why only physical? When people discuss these game prices it’s usually in the context of the second-hand collecting market. Digital stores price games based on very different criteria, and there’s less complete data available. This means no DLC, or digital-only, and few indie games were included.

Only the most basic edition of a game was included – no collector’s edition, no Nintendo Selects or Greatest Hits, no plastic instrument bundles.

This method includes a lot of yearly sports titles, which possibly shouldn’t count. The original Xbox’s games are especially sports-laden. I’m not very familiar with these games, but someone who loves sports games, and is buying older games might pick up the ones with the specific mix of mechanics they like, right? Or maybe the ones with team rosters they enjoy. Regardless, I didn’t want to pick and choose which sports titles would count, so I included whatever came up. These sports games are a bit cheaper than other genres (it’s hard to quantify how much cheaper), somewhat dragging down the average price of systems with many of them.

I considered first party to be games published by Nintendo, Sony, Sega, or Microsoft. I originally was considering only games developed by those companies, but things get complicated and subjective quickly that way.

Price data was retrieved from https://www.pricecharting.com/ from late December 2017 to early January 2018. All prices are in US dollars.

If you want to see the whole spreadsheet with the specific games, here you go: https://docs.google.com/spreadsheets/d/1ssPpo68hAx3y2TjZ9I5knR26-qgprINnD0dmegrHfp8/edit?usp=sharing

It’s ugly and I didn’t care about writing the complete names or fixing typos. Scroll down for the bar graph.