When a popular video game has been out for a while and its sales have slowed the publisher may release a discounted reprint. The requirements and names for these reprints vary by system and region. In North America Nintendo calls them “Player’s Choice” or “Nintendo Selects”, Sony calls them “Greatest Hits”.

This isn’t a comprehensive history of the practice though, what I’m interested in is the secondhand market for these games. Due to the addition of strongly colored banners and other changes to the box art many collectors will turn their nose up at these, considering them an eyesore. Some may consider them too “common” or “cheap” to be worthy collector’s items. Consequently, the common thought is that they are less valuable, and thus sell for less.

It has occurred to me many times that these reprints must actually be the rarer versions, since they are only released once a game has sold most of the copies it is going to sell and the publisher is willing squeeze whatever extra money they can from a game. What an unusual situation, where the rare version of something is cheaper and less desired. Collector’s editions and other variant printings are also less common, but generally sell for more than the base game in the secondhand market.

I wanted to quantify this, just how much rarer are these discounted reprints, and how much less valuable are they? I started with Wikipedia’s lists of games to receive these reprints and recorded the complete price and sales volume from PriceCharting. While I added a few from PriceCharting’s lists that weren’t on Wikipedia, I found I had to remove far more. PriceCharting just doesn’t list the reprints separately for dozens of games.

In total 1,075 games were used, although 38 discounted reprints did not have price data, seemingly because they were so rarely sold. I only used data for “complete” games, this is more common than loose or new. PriceCharting gets its data by looking at completed listings on eBay.

Sales Volume

PriceCharting has a quirky method of displaying how often a game is being sold and I must start by explaining it. Rather than displaying the average number of sales during a standard period of time such as a year, it instead uses the format “X sale(s) per day/week/month/year”. X never contains a decimal, so it has been rounded.

Fifteen different sales volumes were observed from the games I recorded, and it is likely there are no others.

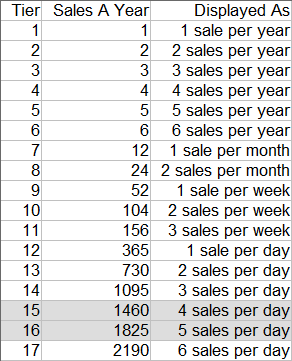
On the right is how PriceCharting describes the sales volume, in the middle is how much this comes to per year, and I broke these down into tiers for some of the graphs I will be using, shown on the left. The two gray tiers, 15, and 16, were never observed and are probably very rarely, if ever, used, considering that tier 17 consists of a single game (try guessing what it is before we get there).

This is a somewhat haphazard way of describing sales volume, and the gap between tiers varies from a factor of 1.2 times to 2.34 times.

Right away we can see that discounted reprints sell less often on average than the original version of a game. No original release was observed as being sold less than once a month, but keep in mind these are some of the most popular games for each system.

The most commonly sold discount reprint version of a game (at 2 a day) was also the most commonly sold original release of a game (6 a day): Wii Sports.

The three original releases at tier 14 (3 sales a day) are all Gamecube releases: Super Mario Sunshine, Super Smash Bros. Melee, and The Legend of Zelda: The Wind Waker.

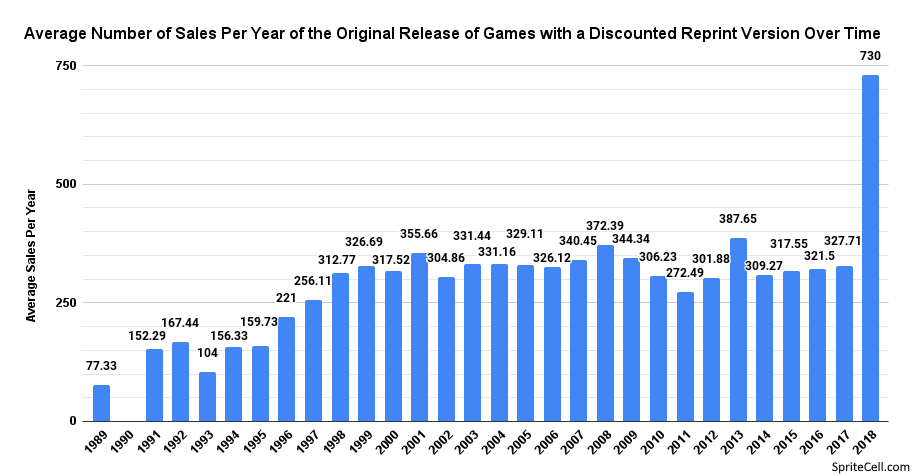
Another thing I wanted to look into was how sales volume changed over time. This isn’t based on the games market overall, just games that have a discounted reprint. I wasn’t able to include the discounted reprints themselves because very few of them have reliable release dates.

The earliest games included were for the Game Boy, but there weren’t many with separate Player’s Choice listings. Volume remains pretty stable starting from 1998, probably due to 4th generation systems phasing out. I would have expected a gradual increase over time, as older games have more time to find permanent homes or be thrown away, and fewer people are interested in the retro scene. There was only one 2018 game included, God of War for PlayStation 4.

Price

I’ve done other studies on game prices before so I didn’t look too deeply into prices alone, but here’s how much the original versions of games with a discounted reprint cost over time. The three Game Boy games from 1989 (Super Mario Land, Tennis, and Tetris) aren’t terribly expensive, but the 1991-1994 games that used cardboard packaging sure are. As games get newer from there they slowly get cheaper.

Price vs Sales Volume

This scatter plot gives some idea of how spread out the prices are in some tiers, but it’s difficult to see much of any correlation between sales volume and price since so many dots overlap each other.

You might not expect the least sold games (remember, tier 1-6 are all discounted reprints) to be so consistently cheap. The most expensive of the discounted reprints was Super Mario World at $287.08, while the most expensive overall was the original release of Super Mario World at $580.00.

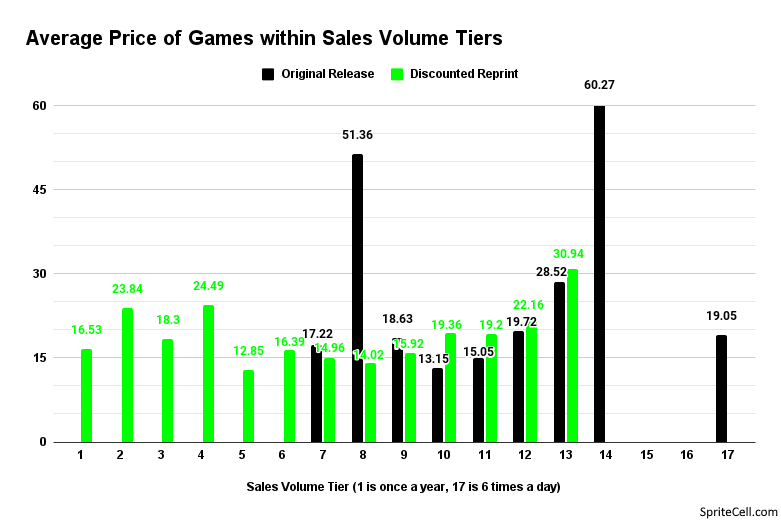
Are the rarest (or at least the least often sold on eBay) games actually the most expensive? It actually seems to be closer to the opposite, although there is not a clear a progression. Some of the wild swings are due to small sample size – tier 8, 14, and 17 among original releases have no more than 4 games each. Discounting them the average tends to creep up the more common a game is.

Discounted Reprint Vs Original Release

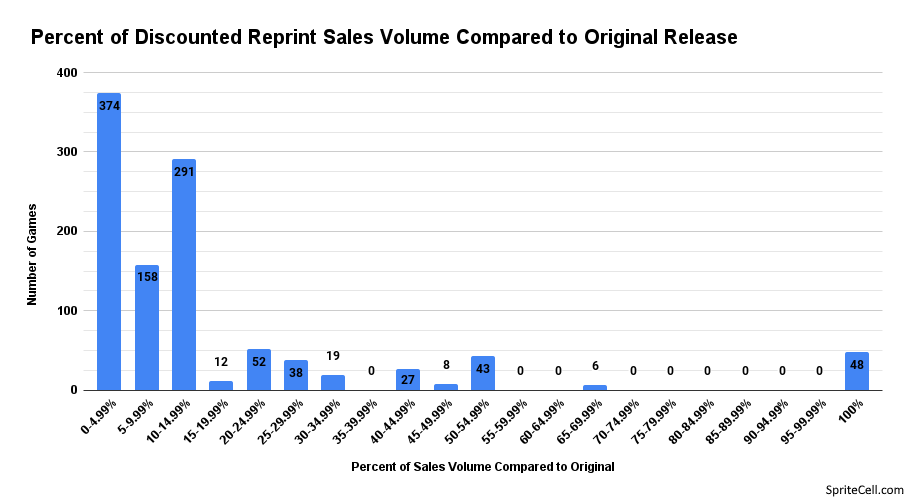
This graph shows just how much rarer discounted reprints tend to be. If a discounted reprint sold half as often the original release, it would be 50% here.

More than three fourths of discounted reprints have less than 15% the sales volume of the original release.

Curiously, for 48 games studied both versions sold in equal amounts. I did not see any particular pattern among these other than none of them being from before the 5th generation.

Here is another way of looking at the price difference between discounted reprints and original releases, we can see the overall trends better than the scatter plot. The price difference is small in most cases, but cheaper is a bit more common.

Prince of Persia: Warrior Within’s Platinum Hits version for Xbox is for some reason over 10 times more expensive than the original release.

And here are the price differences in absolute dollar amounts. For most games the difference is within $5.00 either way.

Super Mario World again holds a record for largest price between versions, with the Greatest Hits version being $292.92 cheaper, while the Sega All Stars version of Ready 2 Rumble Boxing for the Dreamcast is $165.00 more expensive. While I don’t have dates for either release I imagine Mario World’s Greatest Hits release was available for much longer and in much larger quantities.

Some More Trivia

The average cost of the discounted reprint of a game in this study was $16.59, while original releases went for $19.35 on average. Not as large of a difference as I suspected going in to this project.

The average reprint sold 52.09 times a year, while an original averaged 313.53 sales per year.

The biggest difference in sales volume was The Lord of the Rings: The Return of the King for PlayStation 2. The original sells 2 a day, while the reprint sells 1 a year, or 0.14% as often.


Sources

Nintendo Selects – Wikipedia

Sega All Stars – Wikipedia

Greatest Hits (PlayStation) – Wikipedia

Platinum Hits – Wikipedia

PriceCharting


Genre Background

The first part of this project has some important context about how this study was conducted.

I searched several sites with large video game databases to decide how I was going to approach the genre section. I wasn’t totally satisfied with any of them, but I found MobyGames to be the best compromise. GameFAQs has an odd tiered system with a variable number of tiers that is inconsistent about describing certain aspects that I wouldn’t exactly call genres. GiantBomb was inconsistent and less complete. I made a list of 30ish tricky games to assign genre to and looked them up on 4 sites, and MobyGames seemed the best to me. I’m still about to point out a lot of issues, but no genre system is going to be perfect. MobyGames is also essentially a tightly controlled wiki, but things slip through the cracks and don’t get fixed, so I made changes and made things more consistent when it seemed obvious.

MobyGames has 10 genres: Action, Adventure, Compilation, Educational, Puzzle, Racing / Driving, Role-Playing (RPG), Simulation, Sports, Strategy/Tactics. That’s verbatim, and yes it drove me crazy how Racing / Driving has a space on either side of the slash, but Strategy/Tactics doesn’t, and we’re reminded how Role-Playing games are abbreviated. Games can be labeled with as many genres as needed.

Action is very general, covering fighting games, music and rhythm games, platformers, first-person shooters, and sometimes seemingly anything that isn’t turned based or menu driven. Some Sports games included it and some didn’t, confusingly. I made an effort to make it more consistent by removing it from any games that were more on the “sim” side, that weren’t arcadey or had an Actiony side mode.

Adventure, as MobyGames defines it, focuses on narrative over action, and emphasizes dialog and puzzle solving. Includes visual novels, point and clicks, walking simulators, and many games without combat.

Compilations have multiple games in one package. Does not include minigame collections like Mario Party. I removed compilation from many games that included DLC that was sold separately in a previous release, only full games put together counted for this project.

Educational doesn’t seem like it should be a genre at all to me, but these are mostly games for young children about the alphabet or basic math.

Puzzle seems to be used exclusively for games that are all about puzzles, not games that have some puzzles to solve, like the Legend of Zelda series.

Racing / Driving is included in some games with vehicular minigames or sections, like Grand Theft Auto.

Role-Playing games includes games like Dark Souls and Monster Hunter as well the The Elder Scrolls, Final Fantasy, and Persona.

Simulation for our purposes includes Cooking Mama, Nintendogs, most of the Imagine and Petz series, Phoenix Wright, and Guitar Hero. This is probably the most eclectic genre.

Sports includes wrestling, hunting, billiards, fitness, and some horse games.

Strategy/Tactics includes the Jackbox games, city builders, war games, board games, card games, and the Worms series.

Genre – General Distribution

Overall, nothing comes close to action. Yearly releases of many sports games keeps them the second most common. Role-Playing is higher than I would have expected, especially compared to Racing / Driving games.

I really like this chart, you can see how the industry has changed and how what kinds of games it makes has evolved over time. Although classic point-and-click adventures are rare now, the genre has managed to become the second largest. Some of this is because many adventure games are released episodically, and then bundled, resulting in a lot of separate game entries.

Sports games have actually become less common over time, perhaps it’s become too hard to compete with the big franchises?

PC is really an outlier here, where in other metrics it’s very close to the overall average due to making up about a fifth of the games included. It’s difficult to really see any trends among hardware companies. The time period a system exists in is probably much more important.

A bit easier to see some minimums and maximums here. Playstation Vita just barely coming out on top for RPGs. Switch really has a different makeup than other Nintendo consoles or handhelds have had. Lots of Racing / Driving games in the 5th generation. The N64 somehow has the largest percentage of Sports titles in its library.

Genre – Genre Combinations

Since games can have any number of genres, let’s look at what Action appears alongside. Not too hard to apply Action to any other genre.

Adventure games come packaged in Compilations fairly often. Almost every Adventure game released episodically eventually had a Compiled edition. I can’t think of any Racing / Driving or Sports games that were also Adventure games. Let’s see, Barbie Horse Adventures: Riding Camp is listed as Adventure and Sports, Yakuza Kiwami 1 and 2 are too (with Action as well). That’s one thing they have in common.

As said before, lots of Adventure Compilations, but a surprising number of Puzzle games in Compilations too.

There are so few Educational games that we can expect a very different graph.

“What is a Puzzle and Sports game?”, you may be asking. A few include Pocket Card Jockey, Vertigo, and Clubhouse Games.

Surprisingly few Racing / Driving games are purely their own genre. Simulation seems like a natural pairing. Racing / Driving games that are also Adventure games include Nancy Drew: The Mystery of the Clue Bender Society and L.A. Noire.

Strategy/Tactics games are a natural fit for RPG mechanics, while driving a car isn’t. I just checked and Final Fantasy XV didn’t count as a Racing / Driving game for some reason.

Simulating playing a Sport or Racing a car make sense, while other genres probably have a side mode or minigame with some kind of Simulation.

Most Sports games don’t intermingle other genres into their gameplay.

Strategy/Tactics games are often about solving the puzzle of how to win, but few are also Puzzle games.


The above graphs in chart form. Here we can see the least combination of genres is Role-Playing and Educational, which makes good sense, these genres serve very different groups and tend to have very different budgets. There were only three such games: Fossil League: Dino Tournament Challenge, Bookworm Adventures, and Bookworm Adventures: Volume 2.

Here is an overall look at what percent of games are one genre. This is different than the previous “This Genre Alone” statistics because those were only considering the subset of games with a particular genre.

Genre and Metascore

The y-axis of this graph starts at 60 to make the differences more apparent, but keep in mind the range of values is 5.13. Action is by far the most common genre, but has the second-lowest average score. Compilation’s high scores could be influenced by the perceived value of a good cost to gameplay time ratio.

And here are the the genres of the best-reviewed games. Adventure, Puzzle, Simulation, and Strategy/Tactics all pretty low considering how many games of each there are.

That’s all for genres, next time it’s completion times.

Sources

GameRankings.com for metascores and some release dates. Archives: 1, 2, 3

MobyGames.com for genres, some release dates, some ESRB ratings, and some ESRB content descriptors

HowLongToBeat.com for main story and completionist times.

ESRB.org for ESRB ratings and ESRB content descriptors

Wikipedia for its many lists of games

This was originally posted on reddit. I probably won’t use data from VGChartz again, but I think it was a fine estimation for this kind of thing. I was surprised it got so little attention, although I’m not very happy with my writing looking back on it now.

A topic that often comes up is how important a series is to Nintendo, which series should get another game, which series are underappreciated, which get the best review scores, and which no one would miss. I wanted to approach this with numbers.

I gathered review score and sales data for 30 Nintendo series, and calculated attach rates. I thought it was important to consider both sales and attach rates because selling 3 million copies on the Wii is different than selling 3 million copies on the Wii U.

This only includes Nintendo published and owned series. Not all of these games are Nintendo developed, however.

I didn’t include some “casual” series, like Nintendogs, Brain Age, or the Wii series. I think Nintendo is done with these, and they targeted a different group than the “core” games we like to discuss.

Series had to have at least 3 games with full data available. Sorry, Kid Icarus, you didn’t quite make it. I wanted this to be more of a historical look at established series, but there’s some Splatoon numbers in the fun stats section.

The Charts

Here is the overview of average scores, sales, and attach rates. The columns on the right are normalized (scaled specifically to that list) numbers so that we can compare things more easily and for the next charts.

The top three in terms of scores don’t feature Mario at all. I knew Advance Wars was liked, but I did not realize they routinely reviewed that well. Donkey Kong Country also surprised me.

Pokemon dominates the sales numbers, although there are some caveats, which you can read about further down. If you consider dual versions as separate games, the average sales are only 9.1, which would still place it at third, and the attach rate would be 8.79, good for 6th place.

Sales and attach rates manage to stay pretty consistent, although some series with most/all of their entries on DS have much worse attach rates.

Post image

Here I add the normalized numbers to give a score based on review scores and sales/attach rate. I think this is an interesting way to look at things, it makes sense to not focus entirely on one or the other. Fire Emblem has seen a big resurgence in recent years and considered one of Nintendo’s big IPs now, yet it is only in the middle of the pack. Mario Party is also surprisingly low, but they really have been churning them out. Pokemon Mystery Dungeon’s large, vocal fanbase online has always mystified me, and here we see it on the bottom, due to its sales not making up for its scores.

Once again, I must mention Pokemon’s unique release structure and how it effects these standings. Scores have a somewhat disproportionate effect on this chart due to Pokemon’s dominance in sales when dual versions are counted as one game (that is how Nintendo does it). If you look at the first chart again you will see that the normalized numbers for sales plummet to .76 for second place, a much bigger drop than scores.

Post image

Here we see which series have a disconnect for sales versus scores, you could say they aren’t selling up to their potential or that they are hidden gems. Advance Wars takes first with its second highest scores and the second lowest sales, none of the four games have sold over a million copies. Mario Golf isn’t a something you hear a lot of demand for, but it’s pretty high up here. Pokemon’s huge sales numbers can’t make up for its merely “great” review scores.

Some fun stats

  • The highest scored game: Super Mario Galaxy with 97.64

  • Lowest scored game: Mario Party: The Top 100 with 53.2

  • Best selling game: Super Mario Bros. with 40,240,000

  • Worst selling game: Maybe Warioware Gold (still pretty new and very speculative number) , maybe Chibi-Robo Park Patrol (Wal-Mart exclusive, not even released in EU)

  • Highest attach rate: Super Mario Bros. with 65%

  • Lowest attach rate: If you don’t want to count Warioware Gold, Advance Wars: Dual Strike with .25%

  • Splatoon sold 4.93 million copies on Wii U (Splatoon 2 is at 6.76 currently). If allowed on the list it would have been 7th on the best selling chart, above The Legend of Zelda’s average. A 36.36% (Splatoon 2 at 34% currently) attach rate would be 1st overall, well above Mario Kart.

  • Average review scores for each system among the games included (this is more for fun, we don’t have a representative sample of games to really consider this a look at which systems had the best games): SNES 87.68, N64 84.02, Gameboy/Color 84.29, Gamecube 83.85, Gameboy Advance 83.5, Wii 81.84, DS 79.18, 3DS 76.73, Wii U 76.66. Interesting that they tend to go down over time.

  • The correlation between review scores and sales was r = 0.3296. Not very strong.

  • 203 games were used for this study

About the score, sales, and attach data

Nintendo almost always releases sales numbers for games that sell over 1 million copies in their financial reports. These are used on Wikipedia to make lists like https://en.wikipedia.org/wiki/List_of_best-selling_Nintendo_3DS_video_games I used these lists for the bulk of the sales data. Most of these games sold over 1 million copies. Please keep in mind these often-quoted numbers are still not exact. Games can sell more after these reports come out, and Nintendo isn’t going to include a game in their reports forever. For games that sell less than one million, I have to go with the best estimates that exist, which is usually VGChartz. The errors on these numbers are certainly higher than Nintendo’s numbers, but it’s the best we have. None of them seemed particularly unlikely to me, but keep in mind that lower-selling games are more likely to be more wrong. Sometimes I was able to find supposed leaked sales estimates from NPD and I used these when possible.

I used GameRankings instead of Metacritic for average review scores mostly because it goes back farther and they are given to two decimal places. Unfortunately, it does not have NES scores. Attach rate is the percent of copies that exist relative to the hardware. If a game sells 1 million copies on a system that has sold 100 million, it has a 1% attach rate.

About the games I looked at

For each series I only included “mainline” games. When it doubt I referred to wikipedia or series-specific wikis to draw these lines. I’m sure people will disagree with some of the inclusions and exclusions, but in the context of talking about “which series does the best/deserves a new game”, it doesn’t make sense to consider Kirby’s Dream Course to be the same series as Kirby Super Star or Kirby’s Avalance, games which all play very differently. There aren’t always clear lines, and some series like Yoshi platformers are all over the place, so here are some examples: Star Fox Adventures: doesn’t count. Kirby’s Epic Yarn: doesn’t count. Super Mario Maker: doesn’t count. Donkey Kong Land trilogy: doesn’t count. Yoshi Touch and Go: counts. Tri Force Heroes: counts.

No ports or remakes, I wanted this to focus on games that were brand new when they released and free of “oh yeah, I remember liking this game” or “this game feels dated” reviews. I did, however, include pretty-much-identical ports to other systems if they happened within a year, such as Smash 4 and Twilight Princess. This ended up being beneficial to Pokemon since games like Platinum and Omega Ruby get lower scores and have lower sales.

Speaking of Pokemon, it was difficult deciding how to approach it. You have dual releases that are almost identical and have their sales numbers added together. Review sites generally review them as one game, though there are exceptions, every game has slightly different scores. However, a pretty large but unknowable percentage of people buy both versions, essentially two copies of the same game, which means sales data gives a skewed look at how popular Pokemon is. I’m sure there are also people who just wait for the “definitive version(s)” released one or two years later, while others (like me) will buy almost the same game a third time. Yellow, Crystal, Emerald, and Platinum are also much more similar to their base games than Black2/White2 and Ultra Sun/Moon were so you’d have to consider counting the latter if not the former. The remakes are also much bigger deals than other video game remakes usually are. In the end, I decided to count dual versions as one game (so 7 games, one for each generation), and average their scores. No third/fourth versions or remakes included. This gave Pokemon a big boost.

Fire Emblem Birthright and Conquest are reported with their sales numbers combined even though they are definitely more different than Pokemon versions and have more greatly differing review scores. In my spreadsheet I gave them each 50% of the sales.

I did not include download-only games. These games tend to be much lower profile, never seem to have sales data, and have much fewer reviews if any.

No Switch games. Sales and attach rates still have a lot of time to change. There were also no Virtual Boy games included, there’s no sales data or review aggregates.