I was really excited to do this one, I buy almost all of my games used and wanted to quantify some things people kept repeating about prices. Originally posted on reddit.
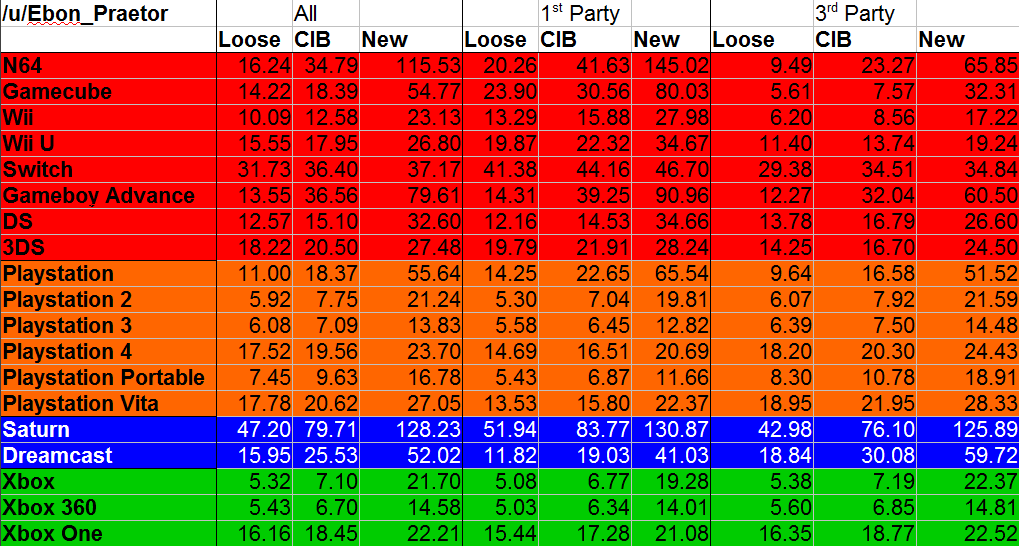
People often say that Nintendo games are more expensive, or even that they never go down in price. Sometimes people clarify that they only mean first party titles. As someone interested in collecting I’ve been curious about this for some time, so I decided to look into the average price of games on different platforms. I entered the prices of 50 games in loose, complete in box (CIB), and new condition for 19 systems, generations 5 through 8.
Since I grouped by company, here are the generations for reference:
- 5th: N64/Playstation/Saturn
- 6th: Gamecube/Gameboy Advance/Playstation 2/Dreamcast/Xbox
- 7th: Wii/DS/Playstation 3/Playstation Portable/Xbox 360
- 8th: Wii U/Switch(I guess)/3DS/Playstation 4/Vita/Xbox One
Some notes and takeaways
None of Switch’s games are even a year old yet, while most of XBone’s and PS4’s are, which is part of why its games are so expensive. I also had to include almost every physical release on the Switch, so there is some obscure stuff there.
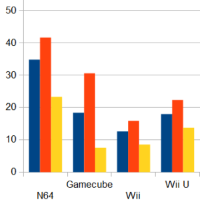
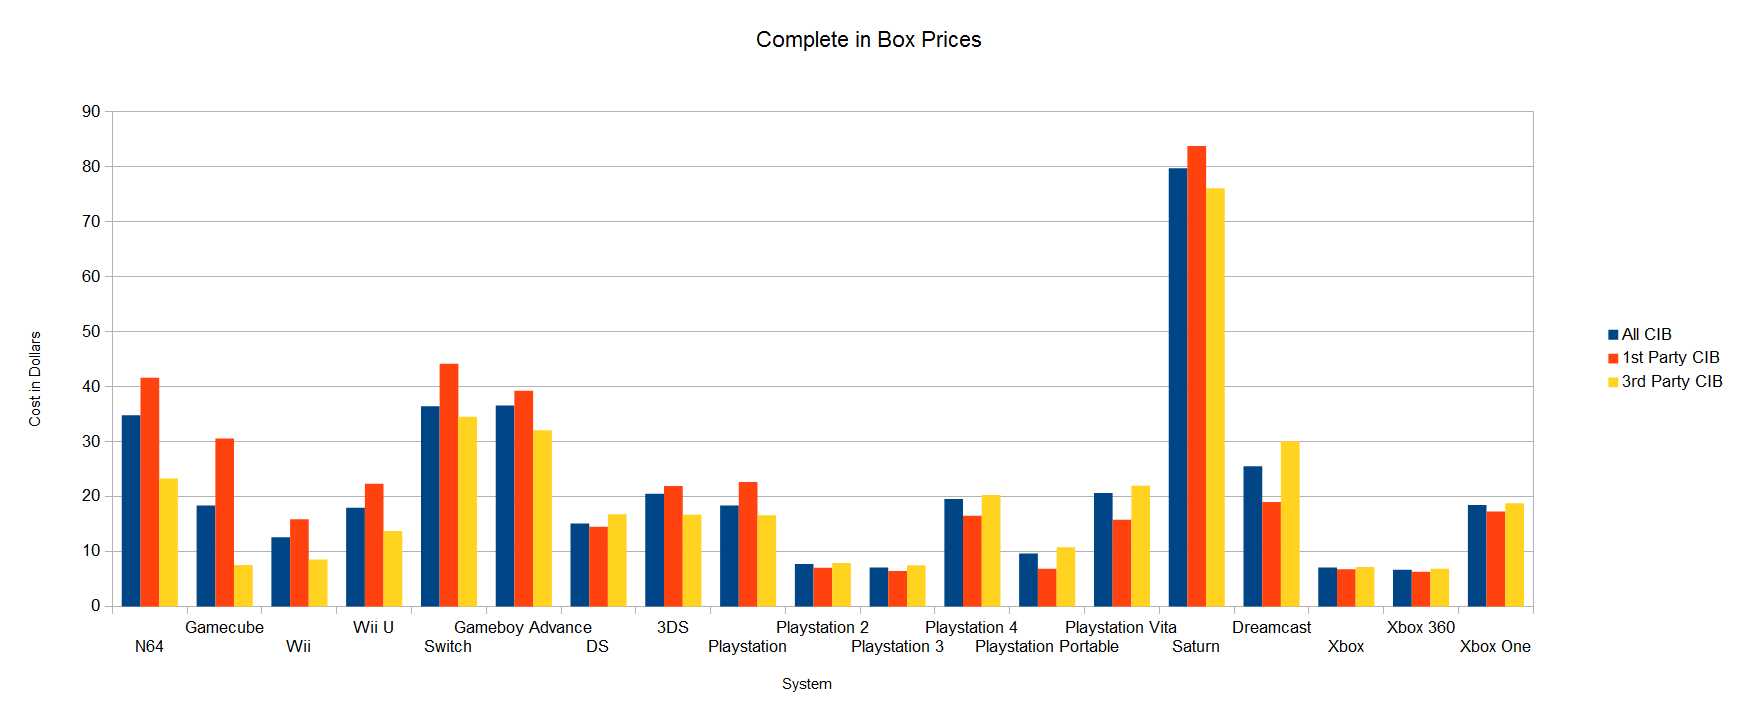
Nintendo games are indeed more expensive on average, although I expect the gap to be smaller when the Switch is as old as the PS4, and 3DS is basically tied with the Vita.
One to two generations old seems to be the sweet spot for cheap games.
The Xbox 360 has the cheapest games on average, but Xbox, PS2, and PS3 are pretty close.
I thought first party games would be consistently more expensive than third across the board, but it was only true for Nintendo games (sans DS) and Saturn.
The Gamecube had the largest difference between first and third party prices.
Some systems had many more first party titles among the games I used than others (N64, Wii, DS), so the third party prices could be fairly different if more games were included.
New prices don’t become too crazy until 3 generations back.
Panzer Dragoon Saga was the most expensive game included – $510.1 CIB, while Madden NFL 2002 for PS2 and World Series Baseball on Xbox were the cheapest CIB at $2.78
2,850 prices were used in total for this data.
Methodology
It’s difficult to know what a good representative sample is, but I wanted to focus on games people are likely to want to buy, and cut out shovelware. First I looked for a wikipedia page like https://en.wikipedia.org/wiki/List_of_best-selling_PlayStation_4_video_games
and added the 15 best-selling. Then, I went to metacritic and added the 15 highest highest rated games that didn’t include anything I’d already added. I filled out the rest by going back and forth between these lists. For systems without a nice wikipedia list, or not featured on metacritic I googled for best of lists.
I only included games released in the U.S. with a physical release. Why only physical? When people discuss these game prices it’s usually in the context of the second-hand collecting market. Digital stores price games based on very different criteria, and there’s less complete data available. This means no DLC, or digital-only, and few indie games were included.
Only the most basic edition of a game was included – no collector’s edition, no Nintendo Selects or Greatest Hits, no plastic instrument bundles.
This method includes a lot of yearly sports titles, which possibly shouldn’t count. The original Xbox’s games are especially sports-laden. I’m not very familiar with these games, but someone who loves sports games, and is buying older games might pick up the ones with the specific mix of mechanics they like, right? Or maybe the ones with team rosters they enjoy. Regardless, I didn’t want to pick and choose which sports titles would count, so I included whatever came up. These sports games are a bit cheaper than other genres (it’s hard to quantify how much cheaper), somewhat dragging down the average price of systems with many of them.
I considered first party to be games published by Nintendo, Sony, Sega, or Microsoft. I originally was considering only games developed by those companies, but things get complicated and subjective quickly that way.
Price data was retrieved from https://www.pricecharting.com/ from late December 2017 to early January 2018. All prices are in US dollars.
If you want to see the whole spreadsheet with the specific games, here you go: https://docs.google.com/spreadsheets/d/1ssPpo68hAx3y2TjZ9I5knR26-qgprINnD0dmegrHfp8/edit?usp=sharing
It’s ugly and I didn’t care about writing the complete names or fixing typos. Scroll down for the bar graph.