Overview
More than two years ago I published the Nintendo Game Project, looking at various statistics of all (at the time) 15,000 games on Nintendo platforms. I thought it would be interesting to do the project again, but with Sony games this time. While Sony doesn’t have as long a legacy as Nintendo, it should be interesting in its own right, and I can do some comparisons. Nintendo can be at odds with the rest of the video game industry, while Sony has largely dominated it since the PlayStation.
I have kept my methods the same as before to facilitate comparisons, but let’s go over them. This study includes officially licensed games from the PlayStation, PlayStation 2, PlayStation Portable, PlayStation 3, PlayStation Vita, and PlayStation 4. My cutoff date for games was the last day of 2020, so not all PlayStation 4 games are included. I have not included PlayStation Classics, just as I did not include Virtual Console games. Unlike last time I did include games not released in North America, Europe, or Japan.
I combined development studios and publishing companies that were owned by another company into one. For example, Ubisoft Paris and Ubisoft Barcelona are both Ubisoft studios, so they both just count as “Ubisoft”. Ubisoft bought Red Storm Entertainment in 2000, so that company counts as Red Storm Entertainment before they were bought, and as Ubisoft after. Sometimes video game companies are bought by non-video game companies, I ignored these unless that company also owned at least one other video game company. For example, Atlus was bought by Index, which also owned Interchannel, so those companies were counted as Index. I counted a company as owned by another if they owned more than 50% of it, so D3 Publisher counts as Bandai Namco from the date that they acquired most of their stock.
Merged companies I counted as a new company. So Squaresoft and Enix are counted separately from Square Enix. If a company changed their name, I used the most recent. When games were ported, I credited the porting studio, whether that was the original creator or not.
Many games are likely fully or partially developed by uncredited studios in countries with cheaper labor, art assets have especially been outsourced in recent years. I can only list developers officially named, please keep in mind that developer and country data can not be perfect.
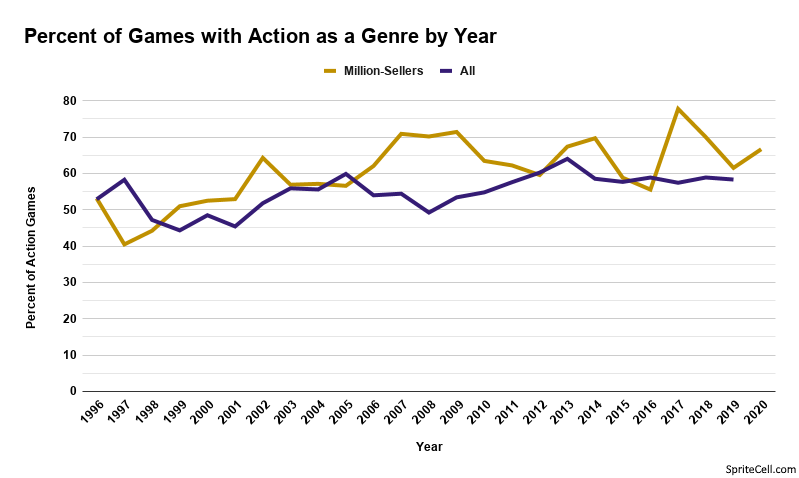
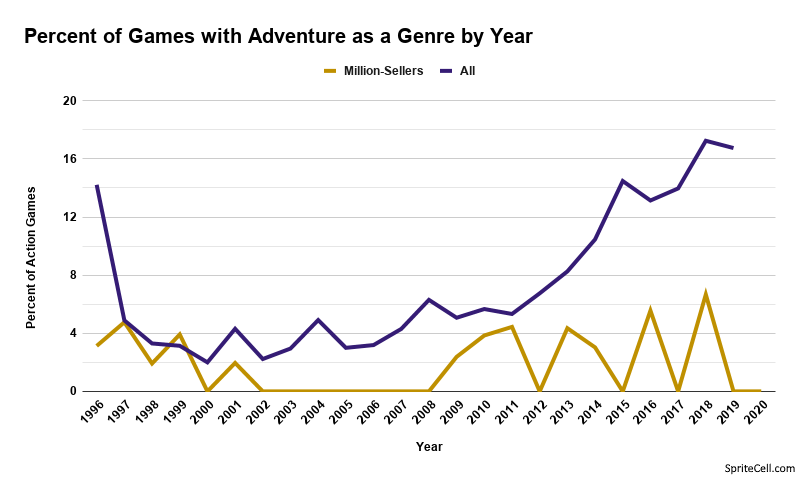
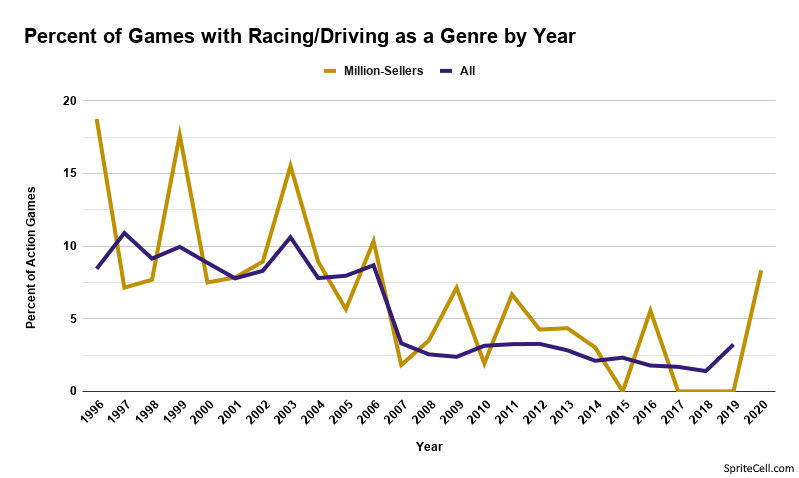
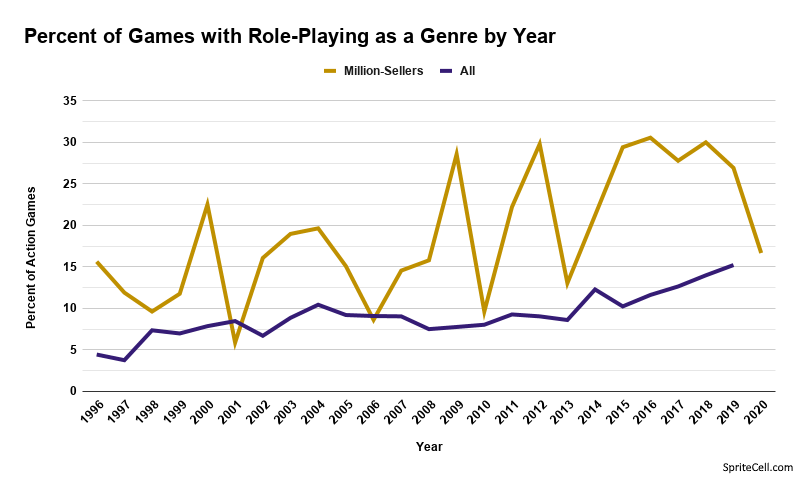
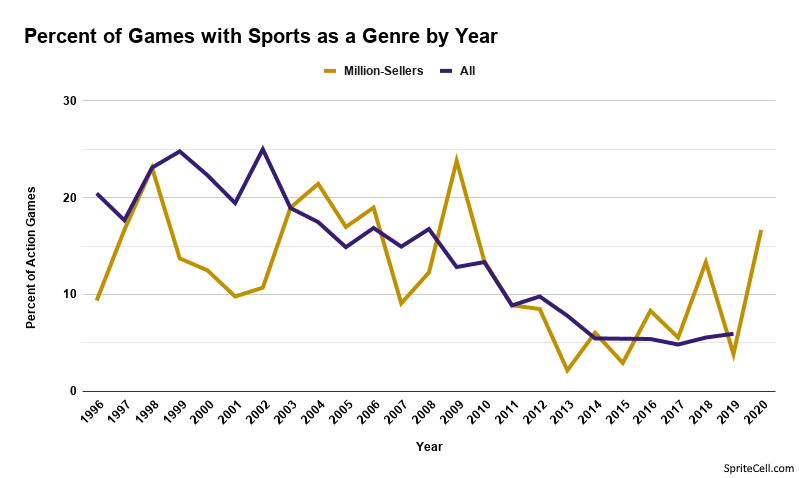
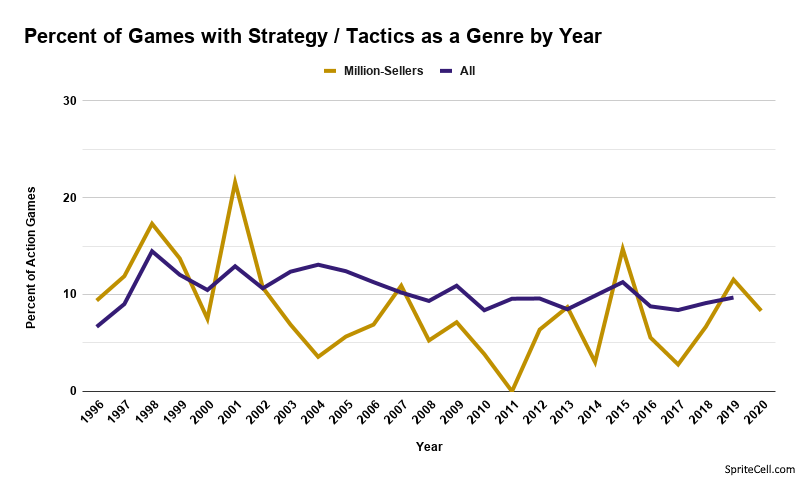
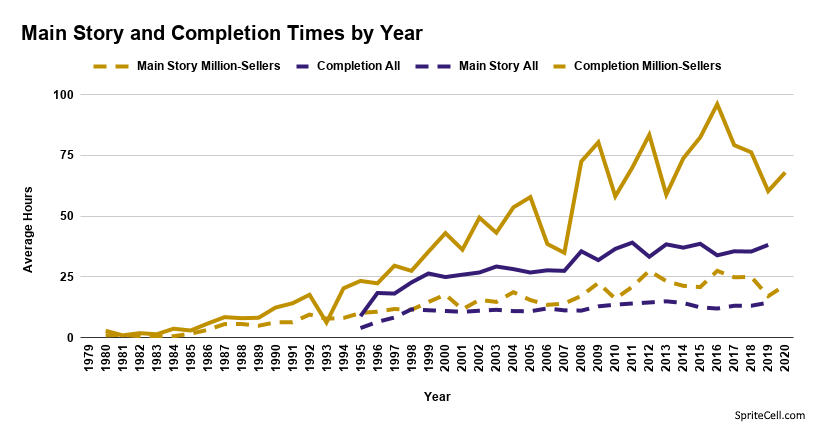
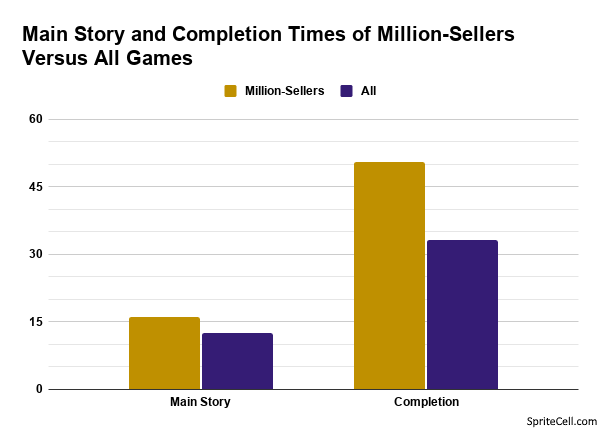
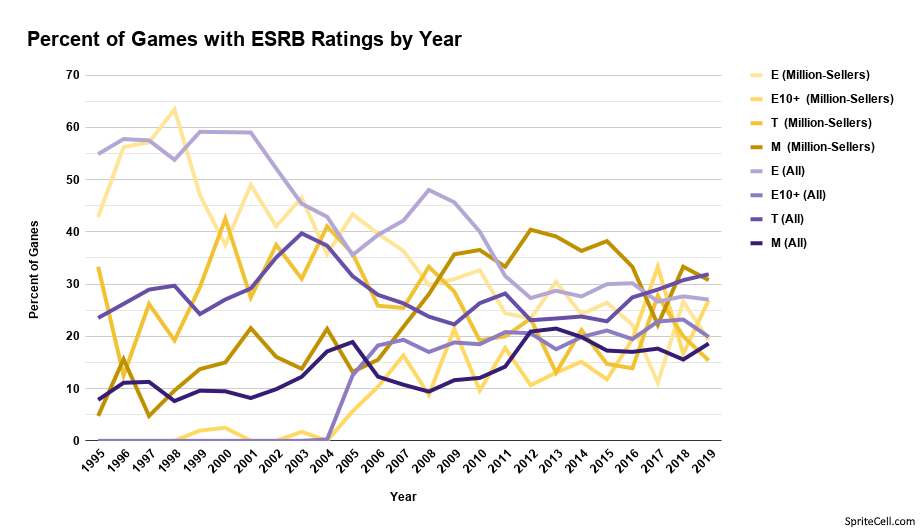
I have included some data from my Twenty-Five Years of Games Across Eight Metrics project, namely ESRB ratings, genres, and average lengths of games. This data only covers games released in North America, and the PlayStation 4 data is a few years old now, though since this data is presented as an average it is unlikely to have changed much.
Fortunately, there were few issues with even the oldest Sony games having no developer named, or with vague release dates.
System Infographics
Before we dig in I have to talk a bit about the original PlayStation and why it’s incomplete. In late 2020 I copied the list of PlayStation games from wikipedia to get started on this project. At the time I thought it was a shame that the PlayStation 4 list would not include many games that would come out before I finished this project. I did not expect to come back to the PlayStation list almost a year later while I was working on these infographics and see that almost one thousand new games had been added to this 25 year old console’s list of games.
Almost all of these games seem to be Japanese exclusives. According to Sony, 4,944 games were released in Japan, which likely means the original PlayStation’s library is even larger than the PlayStation 2’s. I’m glad Wikipedia editors are documenting these games, but I do wish I had somehow timed things better. This throws my numbers off for the number of games developed in Japan, and the top developers and publishers is likely off a bit too. I apologize for the errors.
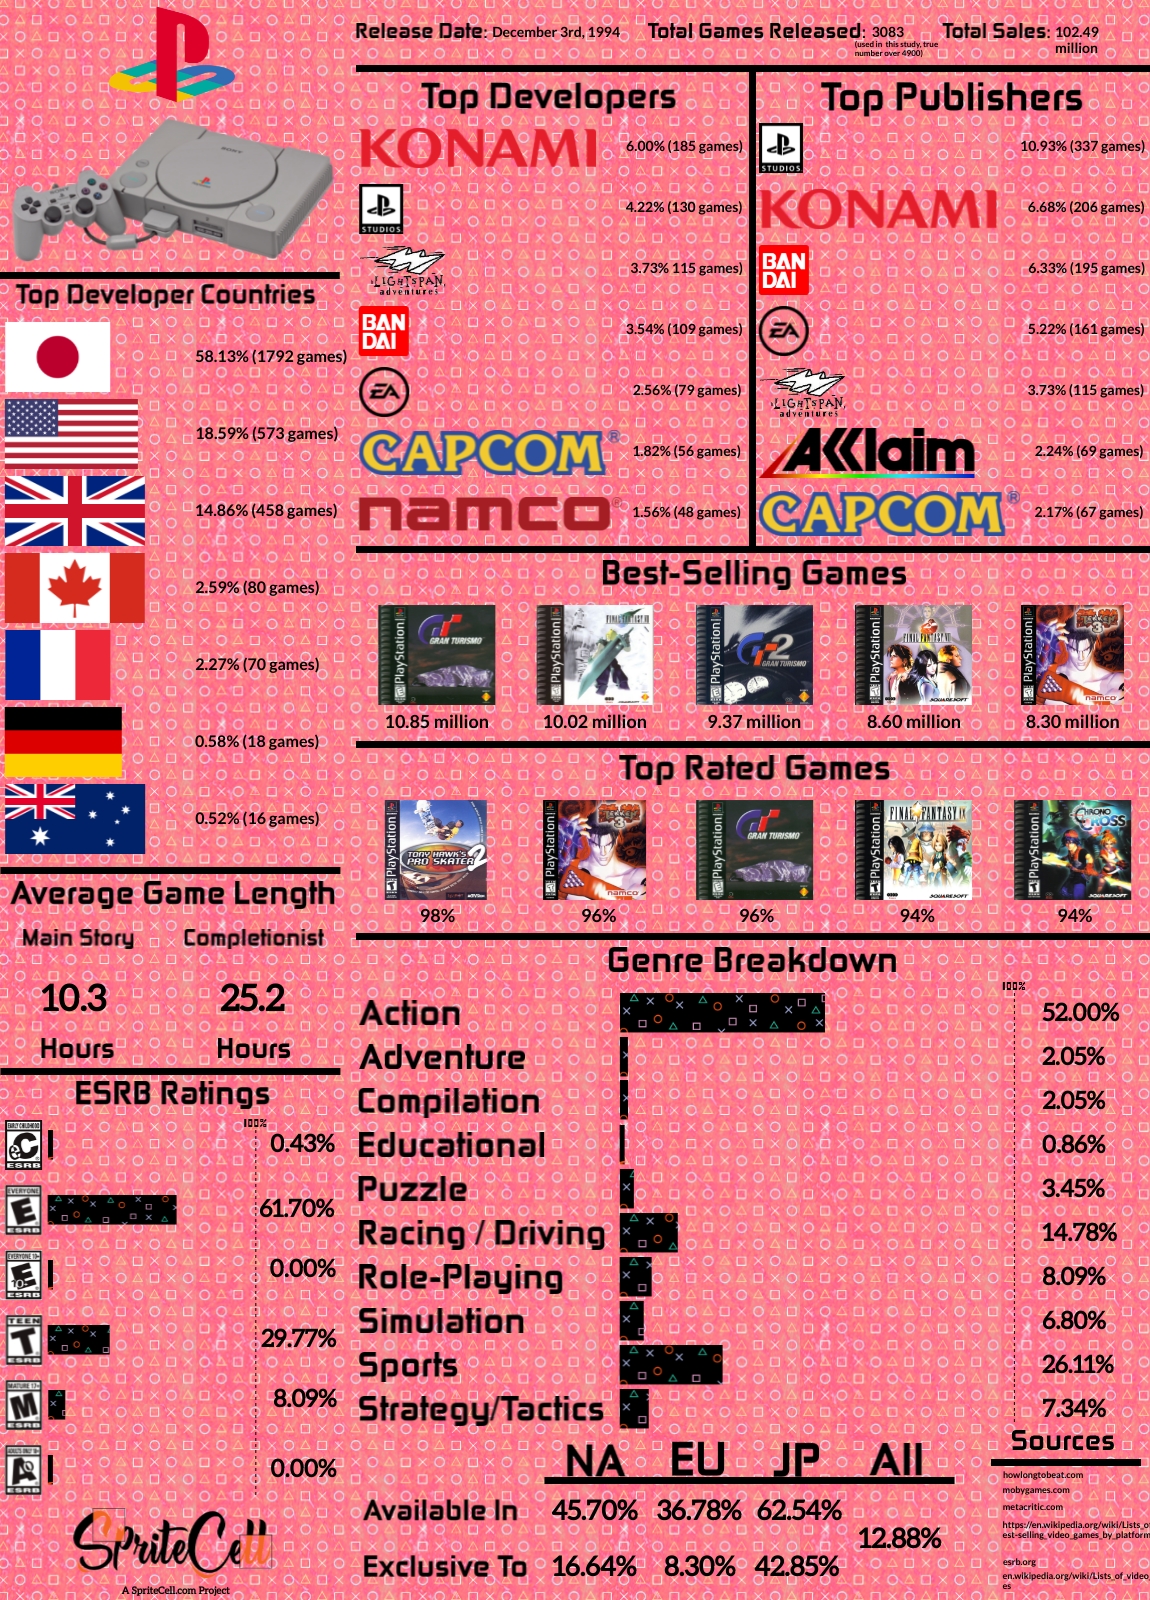
Sony’s first system was an immediate success, with over 10 times as many games as their nearest competitor, the Nintendo 64, and selling three times as many hardware units.
We’ll be seeing Konami a lot on these lists, and they are off to a roaring start here. You probably haven’t heard of any of Lightspan Adventure’s games, even though they released over 100 titles for the PlayStation. Lightspan sold educational games directly to schools, and were quite prolific while they lasted.
While many will call PlayStation a haven for Role-Playing games, it actually has the smallest share of them of any Sony system. What it does have the most of is Racing and Sports games.
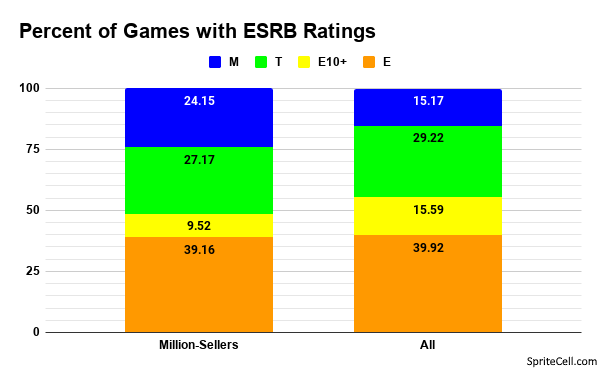
The age ratings of PlayStation games are heavily skewed towards younger audiences with the highest share rated E for Everyone and lowest share rated M for Mature among Sony systems.
This was before the E10+ rating was introduced, but the PS1 has the only Early Childhood games on a Sony system (probably, it’s harder to find Early Childhood games since the ESRB got rid of the rating and made them unsearchable for on their website).
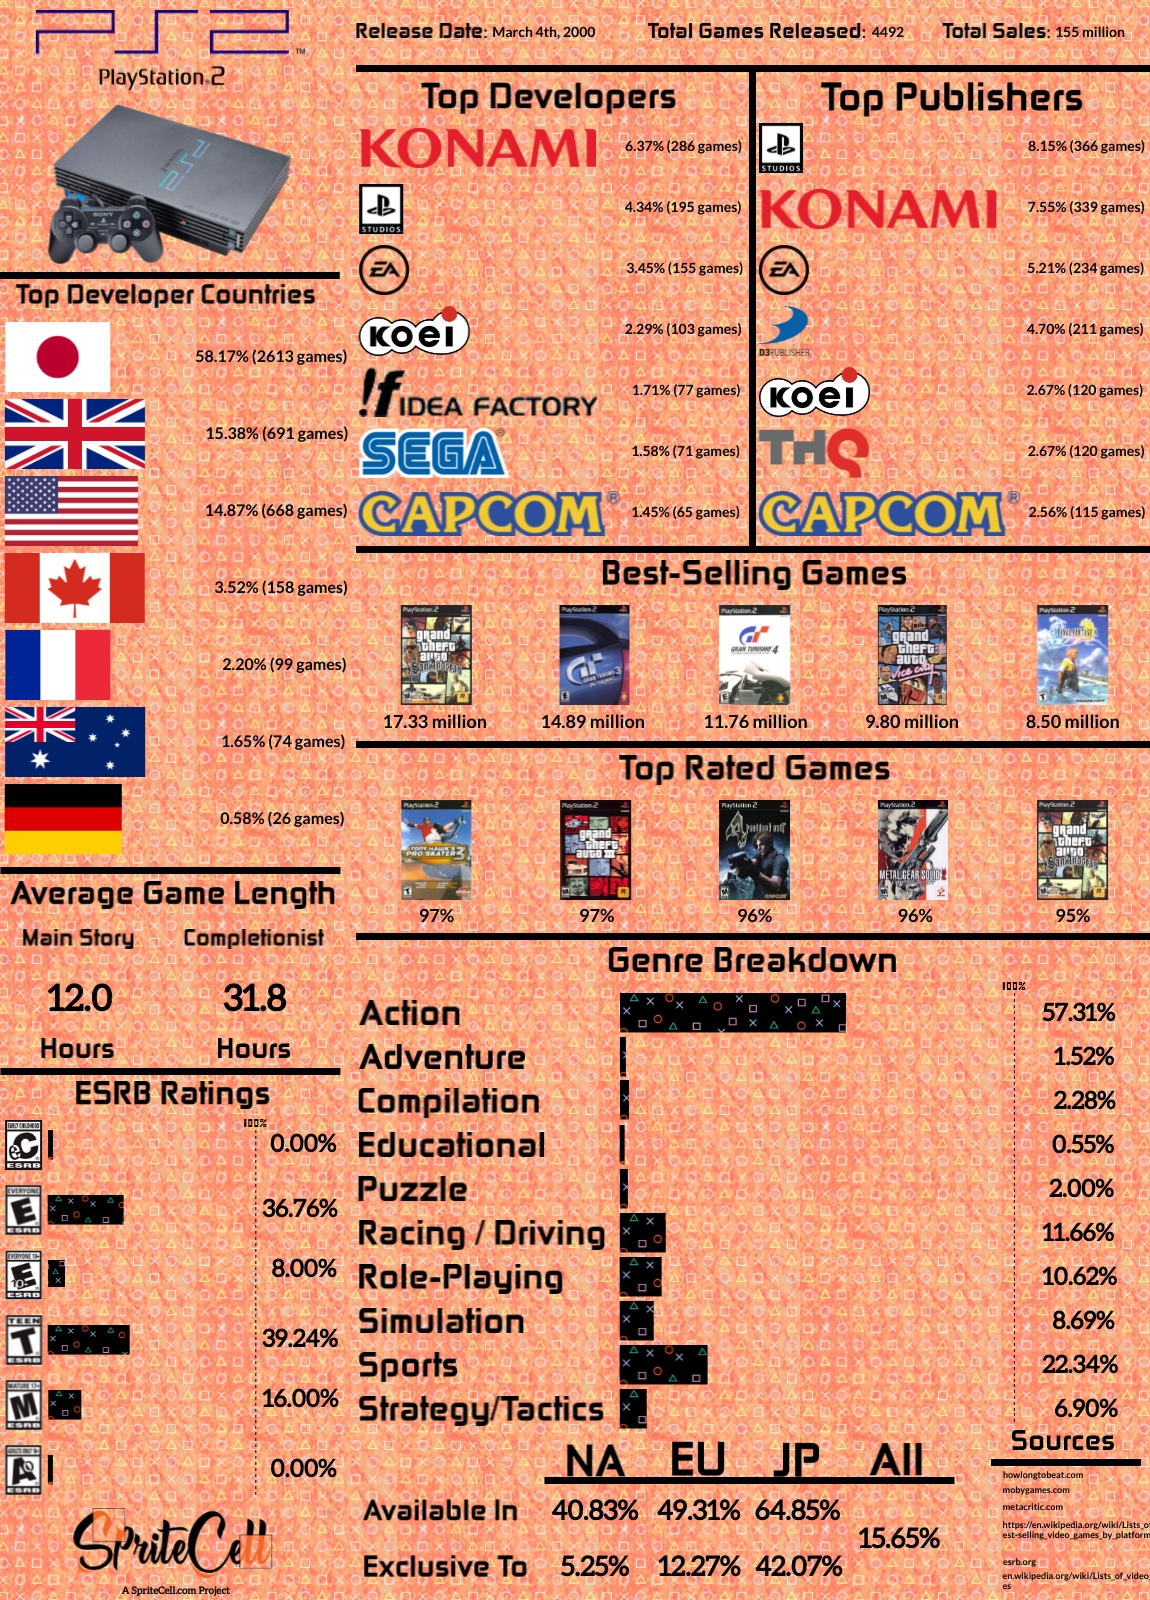
The PlayStation 2 is the best selling video game system of all time with a huge and varied library.
Konami takes the top developer spot again, by a wide margin. Sega left the hardware business in 2001 and still became a top developer for both the PlayStation 2 and Gamecube. They merged with Sammy in 2004, and if you were to count Sega and Sega Sammy as the same company they would be ahead of Koei among developers, and in the top 7 publishers. Very few of Idea Factory’s games left Japan, but they mostly make tactical RPGs and visual novels.
With two systems to compare we can see some trends: games have become more mature, longer, and less exclusive to one region, though not so much with Japan quite yet.
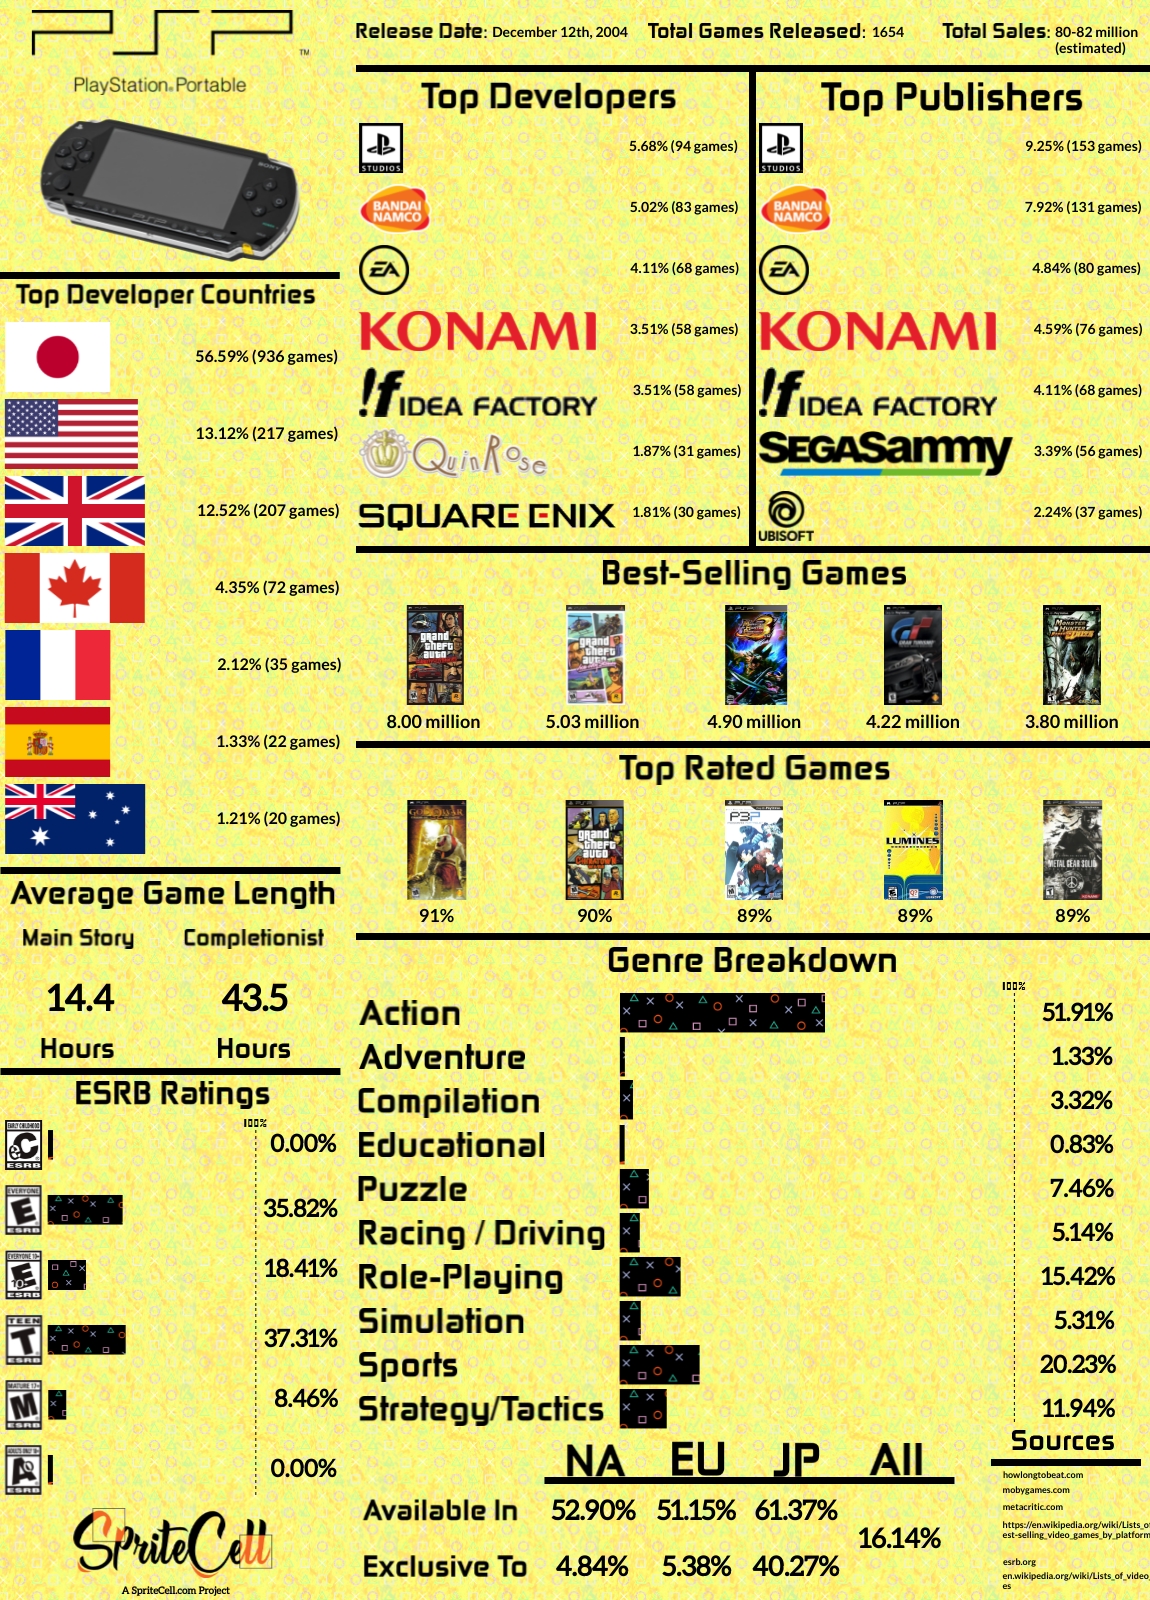
Being a handheld, the PlayStation Portable still has a strong Japanese presence. I was a bit surprised to see how many sports and racing games Electronic Arts released. QuinRose made otome games, published every single one themselves, and not a single one left Japan.
Puzzle, Strategy/Tactics, and Role-Playing games reach higher proportions on the PSP. If my genre data had included Japanese exclusives the PlayStation Portable would likely have looked fairly different, with many Japanese-exclusive visual novels qualifying as Adventure games.
This is the only Sony system where one of the top 5 best sellers is exclusive to one region: Monster Hunter Portable 3rd.
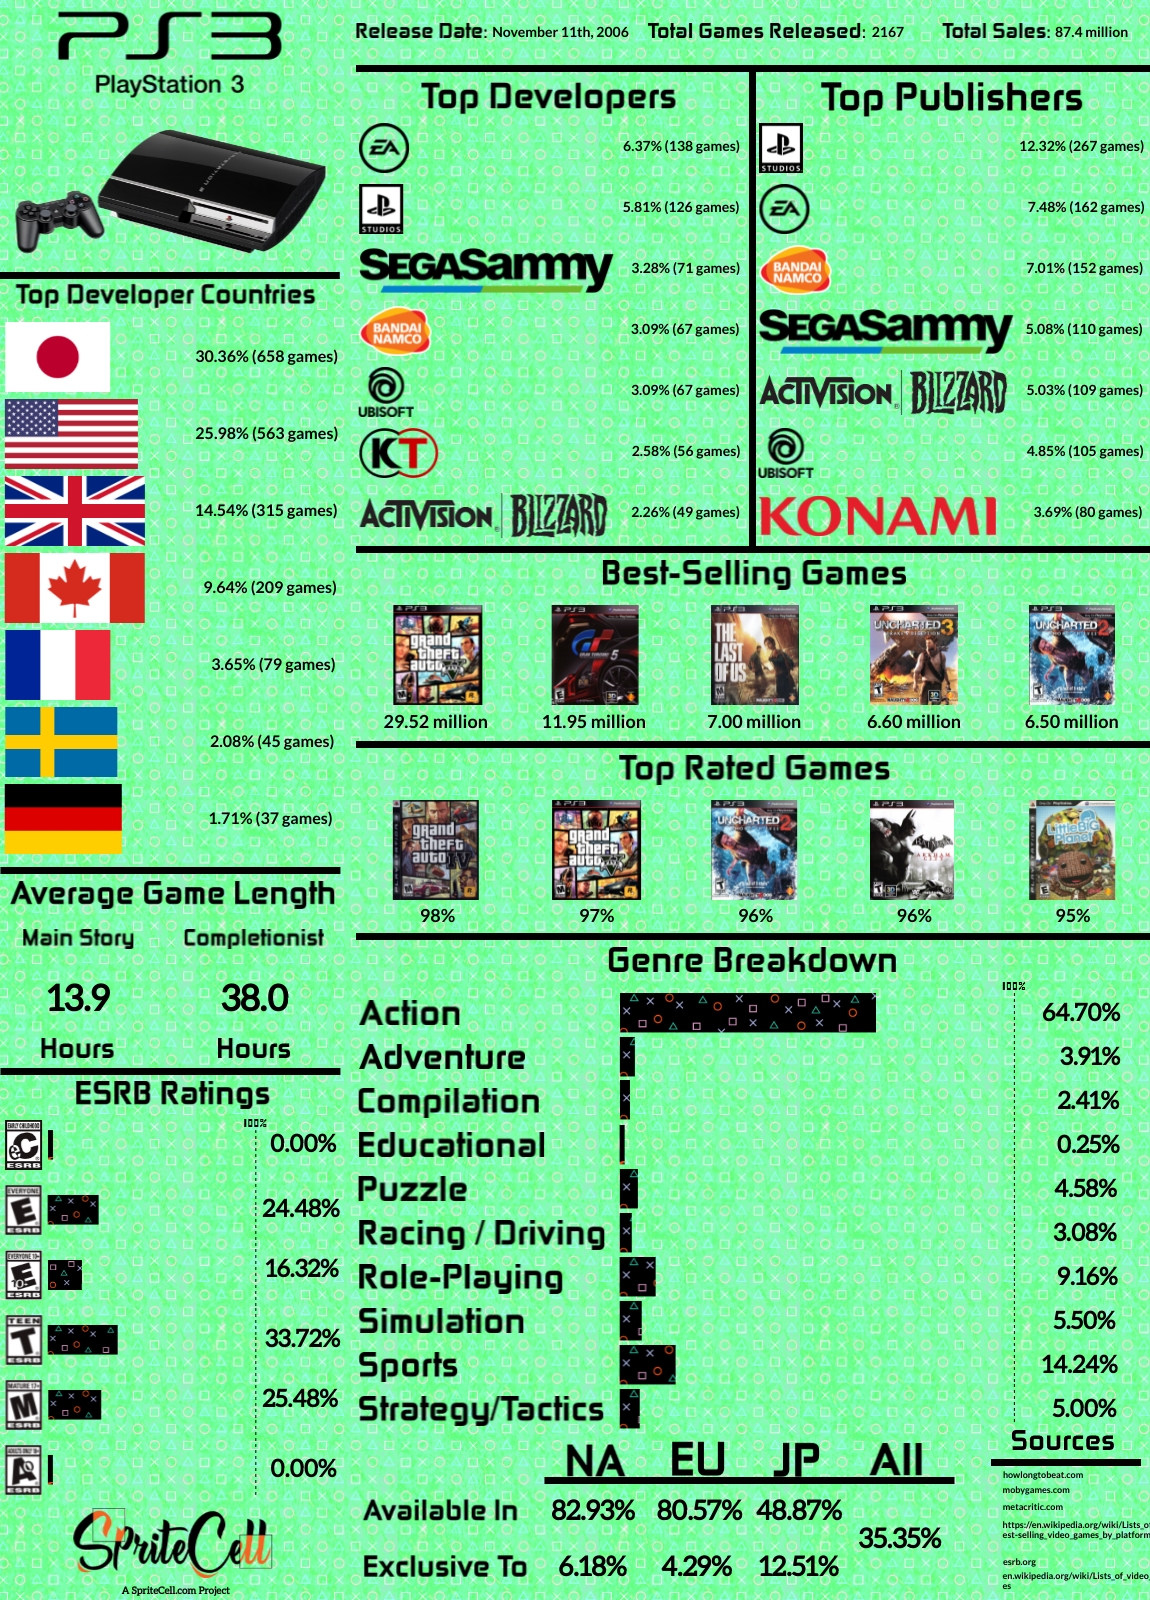
The PlayStation 3 is where things change for Japan. From making nearly 60% of the PS2 and PSP libraries to 30%, and there are also now three non-Japanese companies among the top 7 developers. Japanese exclusives drop from around 40% to 12.51%, and the amount of games released in all regions doubles. Fewer best sellers and top rated games are developed in Japan.
Regional exclusives in general suddenly become much less common, and with Japan making fewer games they are now the region missing out on the most games.
I would have expected average game lengths to increase with the advent of trophies, but it actually goes down a bit from the PSP.
There is also a shift towards more games with more mature age ratings.
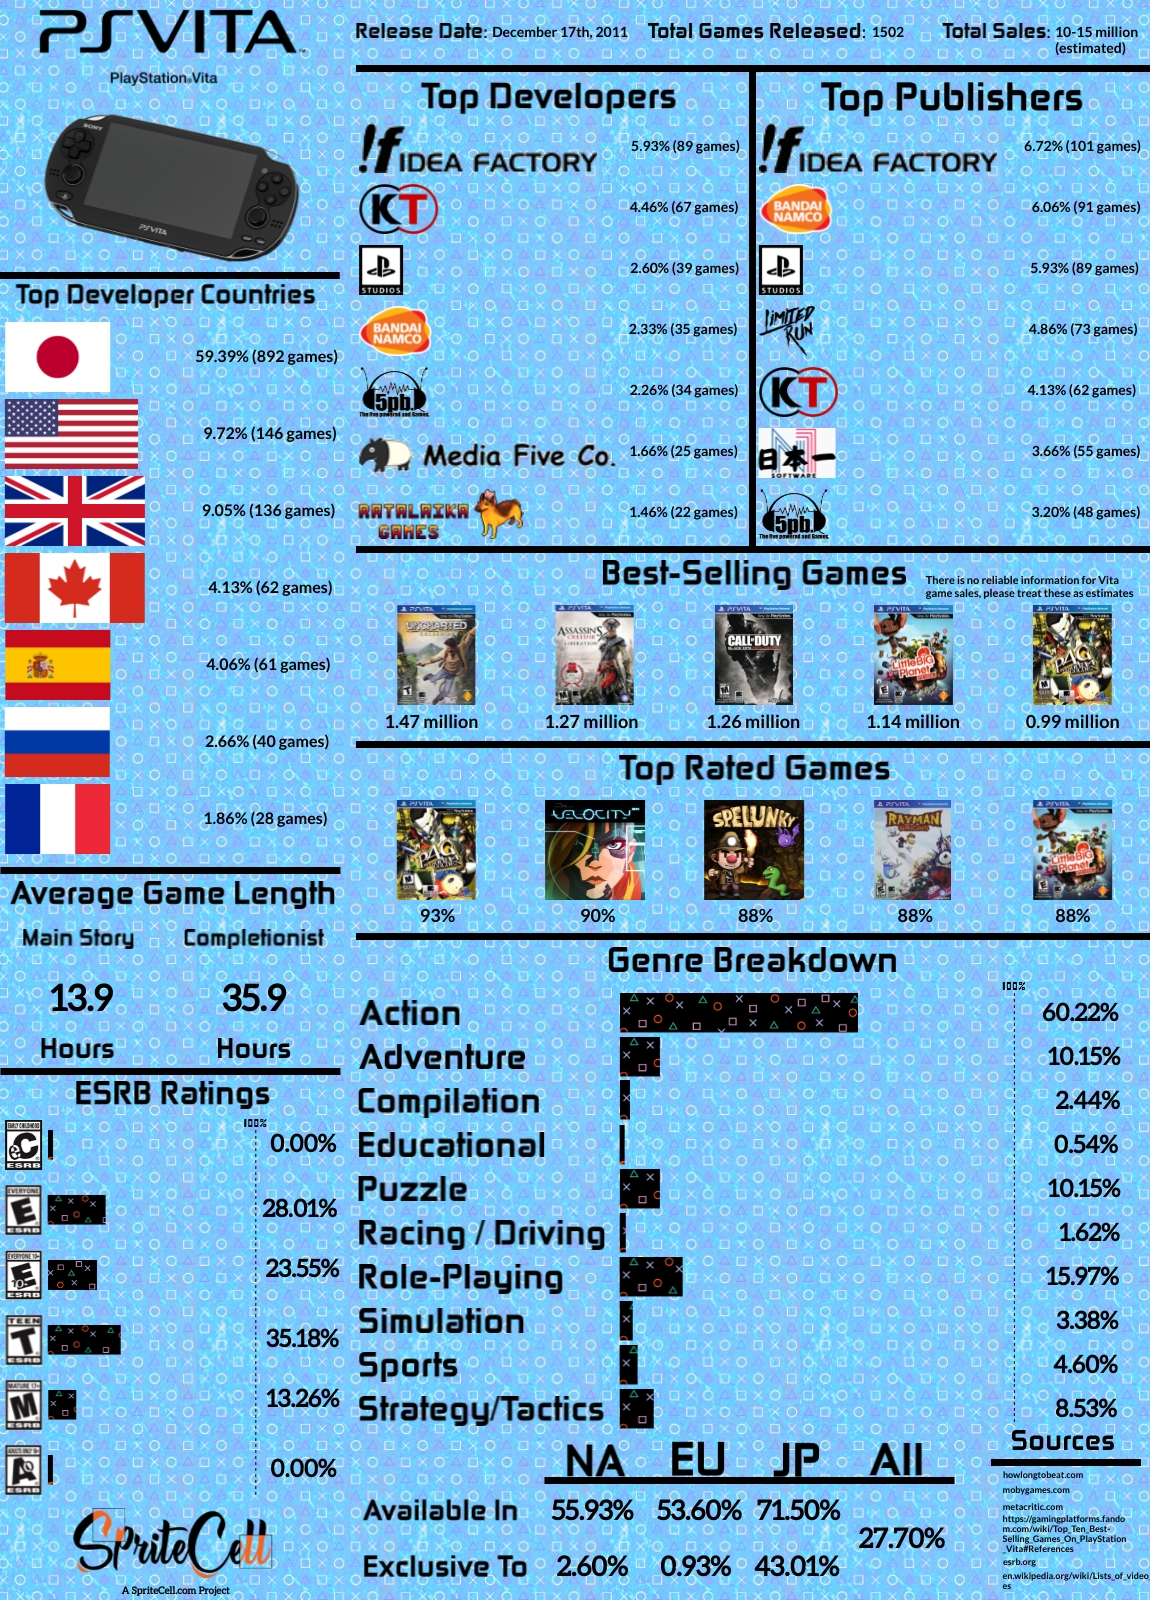
The PlayStation Vita is Sony’s biggest aberration, receiving little support after its first few years and selling much less than any other Sony system.
While the PS3 stepped away from Japanese games, the Vita was much more popular there than anywhere else, and there were about the same portion of games released there as with the PSP. Meanwhile, the North American and European markets had nearly identical libraries.
Without Electronic Arts’ support there are much fewer Sports games, and we see some new companies in the top 7s, while Sony develops and publishes fewer games than any of its other systems. Idea Factory and 5pb made a lot of visual novels. None of Media5’s games left Japan, 18 of them start with “NextRev” and might be designed to help you study for various kinds of exams, such as nursing, if I can trust google translate. We’ll talk more about Limited Run in a moment.
Sales data is very limited for the Vita, with very few official announcements, likely due to its poor sales.
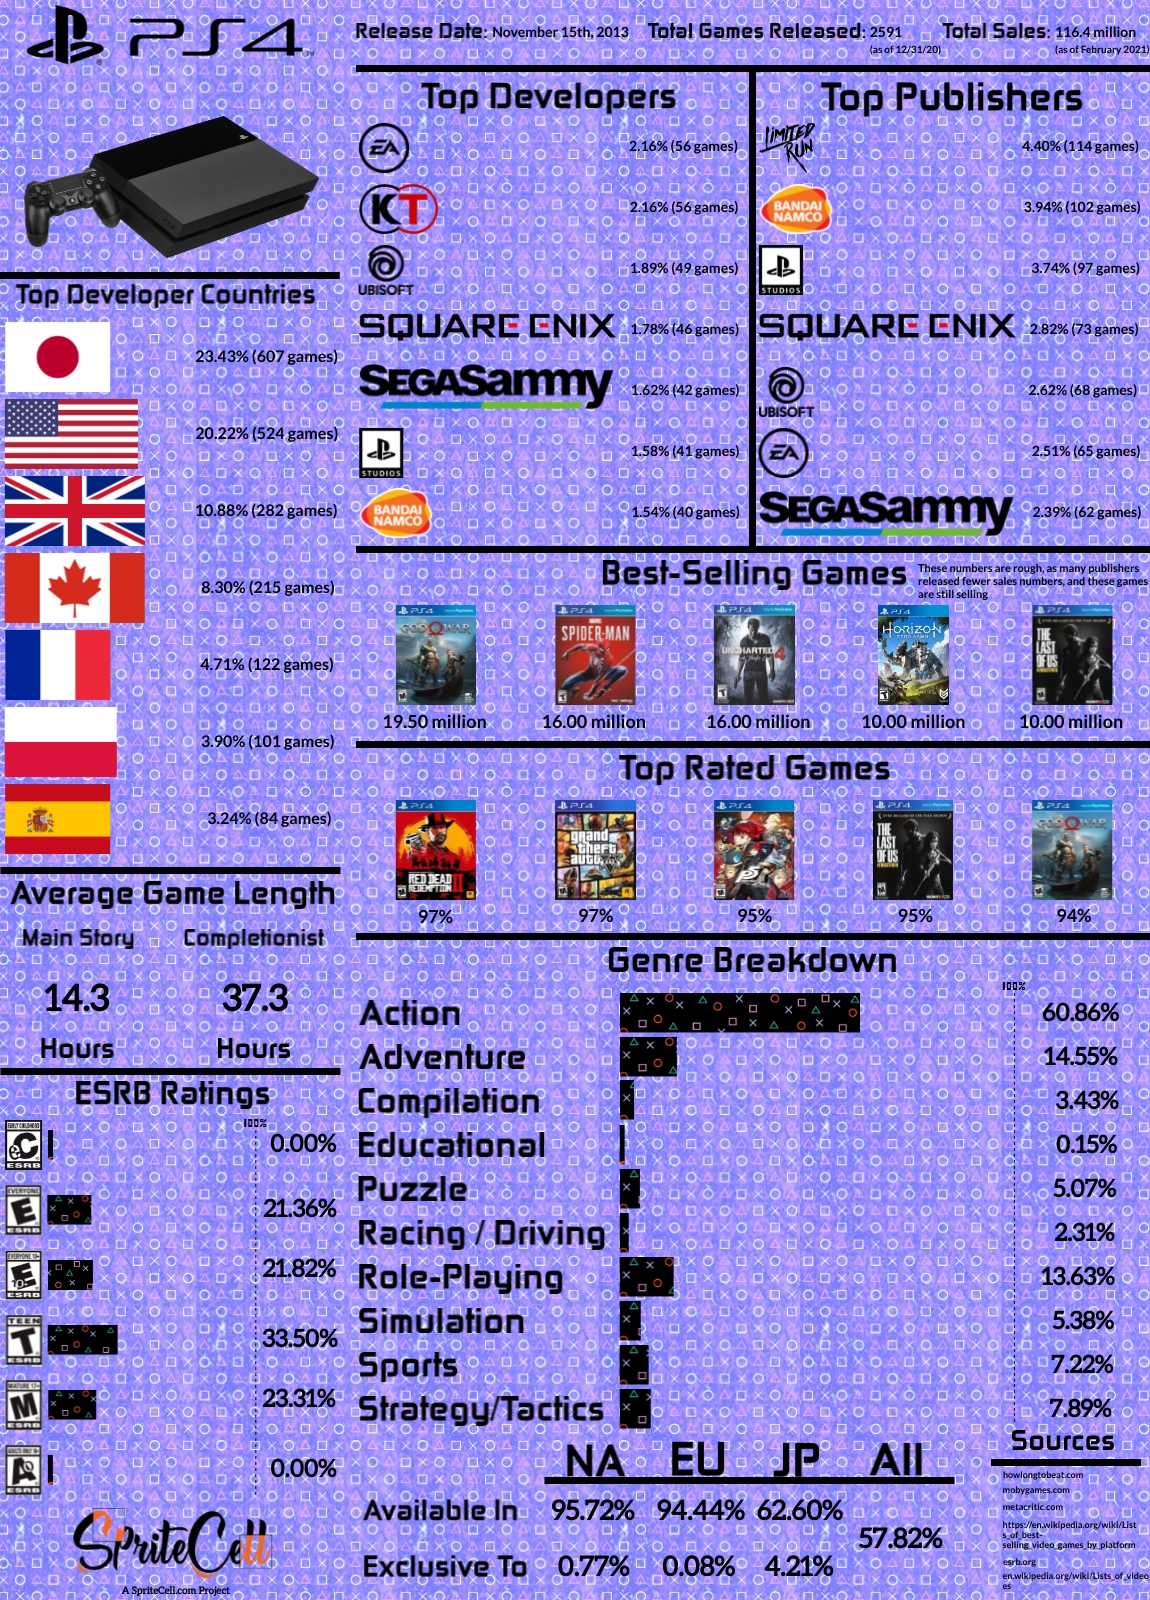
The top developers and publishers represent much smaller pieces of the pie than ever before with the PlayStation 4, something also seen with the Switch. Games take longer to make, and there are more small studios making games than ever before.
Limited Run was the first and probably currently is the largest company making limited amounts of physical versions of smaller, mostly indie, games that wouldn’t otherwise have been able to release physically. Their first PS4 release was about 2 and a half years into the system’s life, making it all the more difficult to claim the top spot. Limited Run were just getting started with the Switch when I released my Nintendo project, I’m sure they are currently near the top there too.
Japan falls even further in the country rankings, but barely manages to remain the top producer of PS4 games.
While the Vita’s sales numbers are likely spotty due to poor sales, there also seems to have been a change with major publishers in this era that led to them releasing fewer and more vague sales numbers, which is why these sales numbers are so nicely rounded. Many reports by these companies now focus on total revenue or number of active players. Nintendo on the other hand releases sales numbers to the ten-thousandths place for any titles that have sold at least one million copies every quarter.
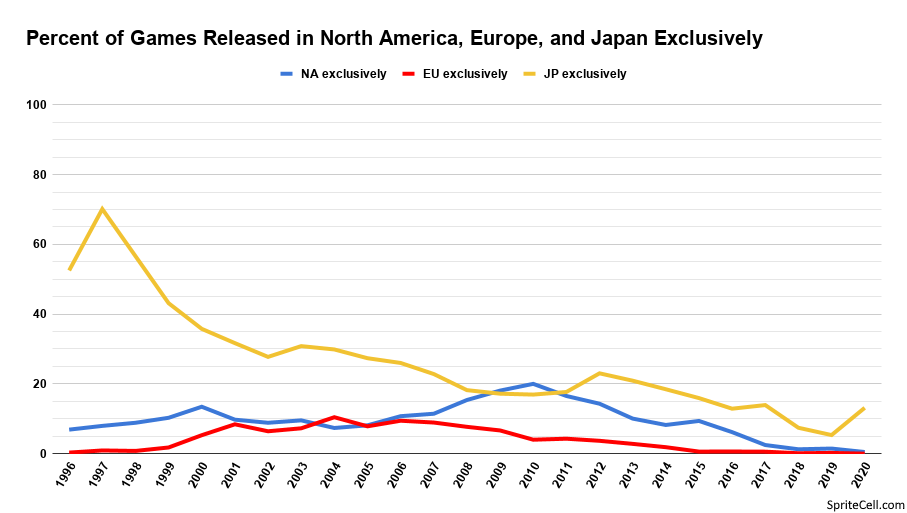
At this point region exclusivity is almost dead, I had only 2 European exclusives recorded for the PS4. Japan has become the big loser when it comes to games not being localized.
Sony Games by System
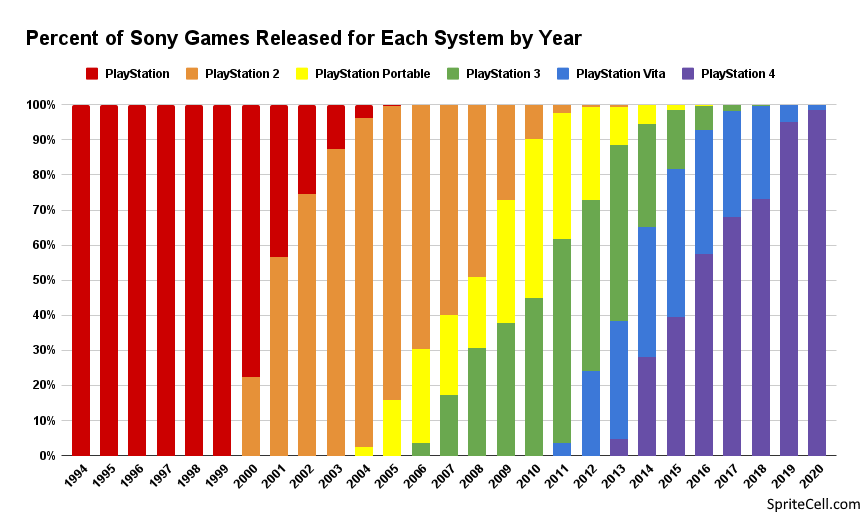
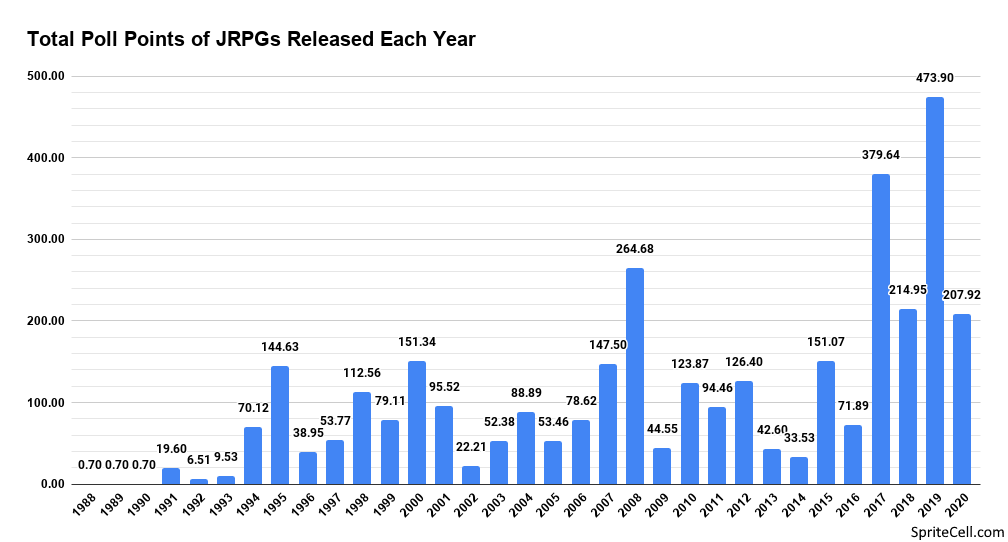
This graph shows us the lifespan of the Sony systems, and how new systems supplant the old. 2013 was quite a year, with 5 systems receiving new releases.
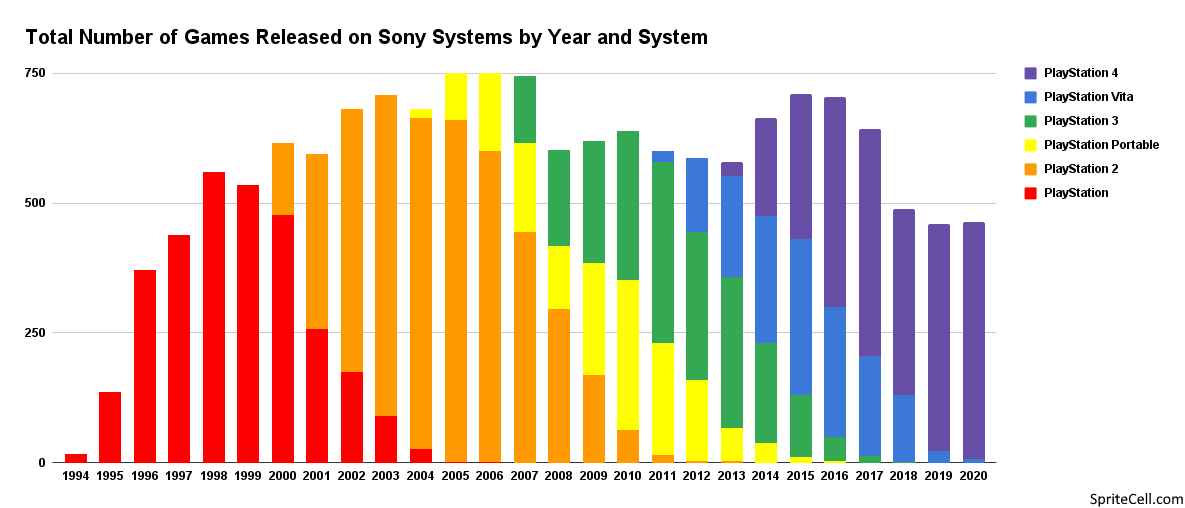
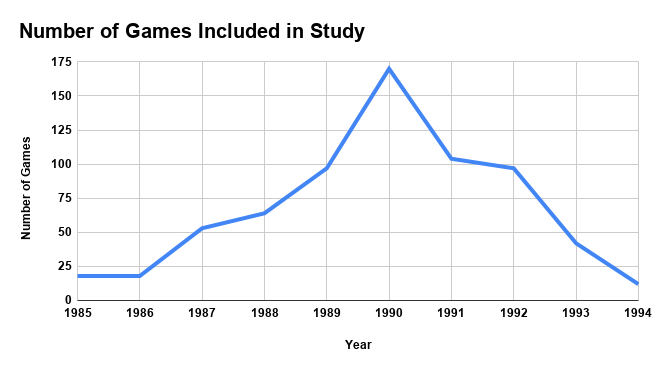
Rather than relative amounts, here we can see the total number of games by year. The PlayStation era numbers should be quite a bit higher, as wikipedia had not documented many games at the time I grabbed its data. The increasing amount of time it takes to produce a game is apparent here with 2018 and on releasing fewer games than ~20 years ago, despite the larger number of developers. Even in the PlayStation 3’s third year it was still barely outdoing the output of the PlayStation 2.
Countries and Regions

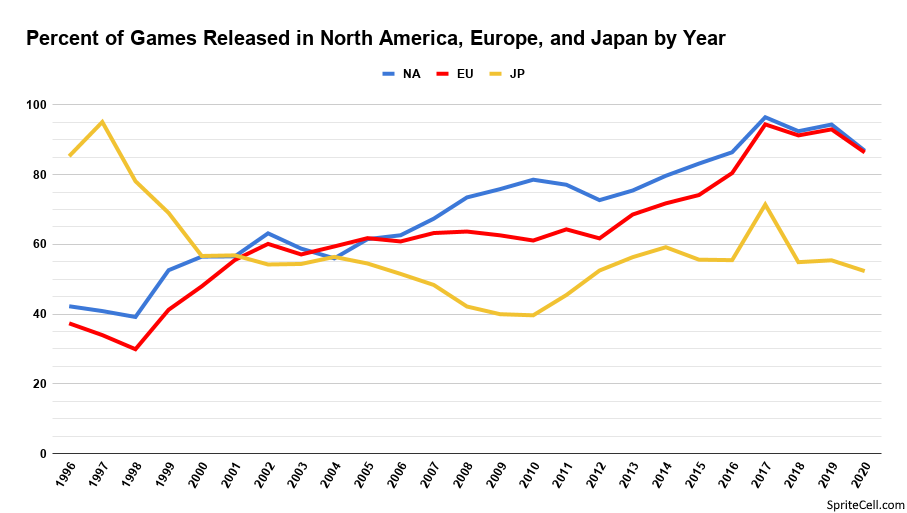
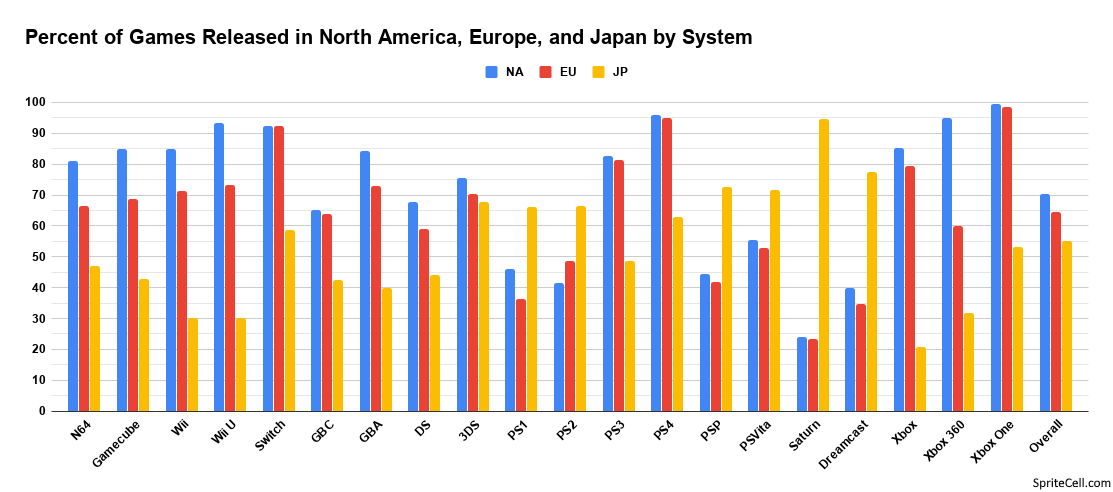
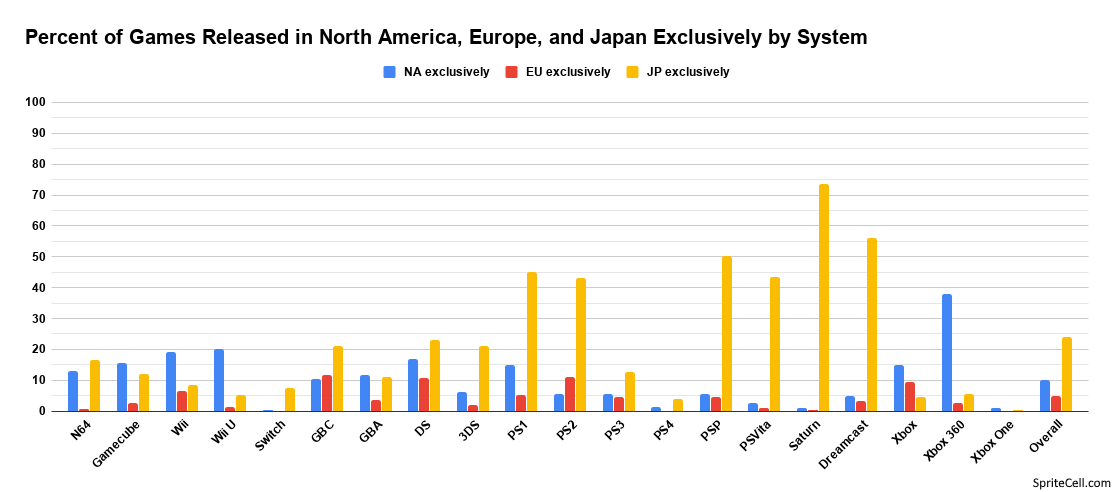
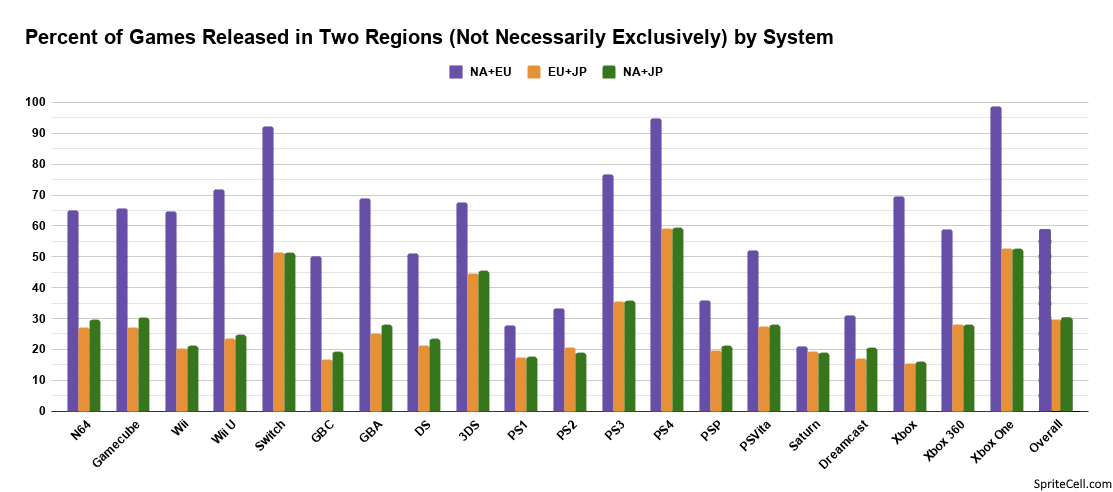
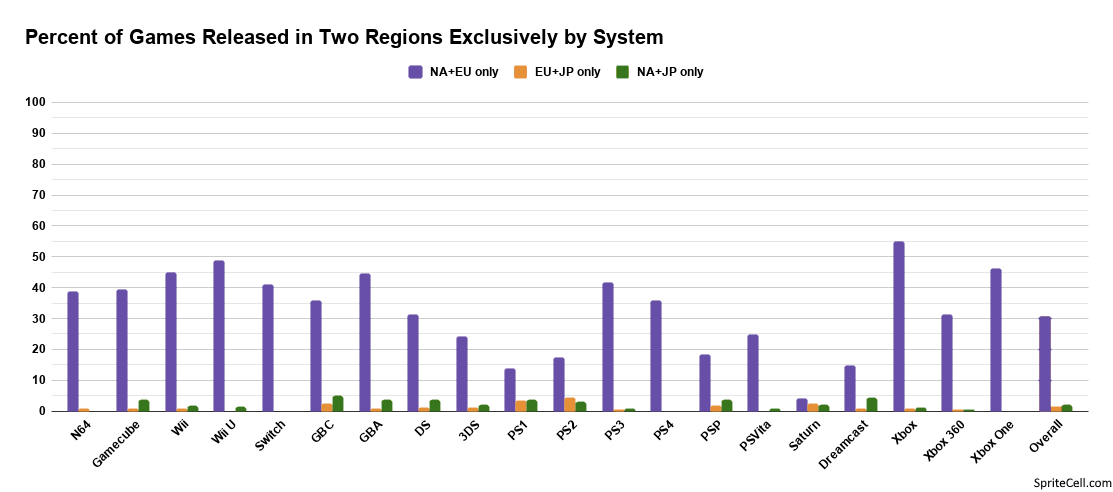
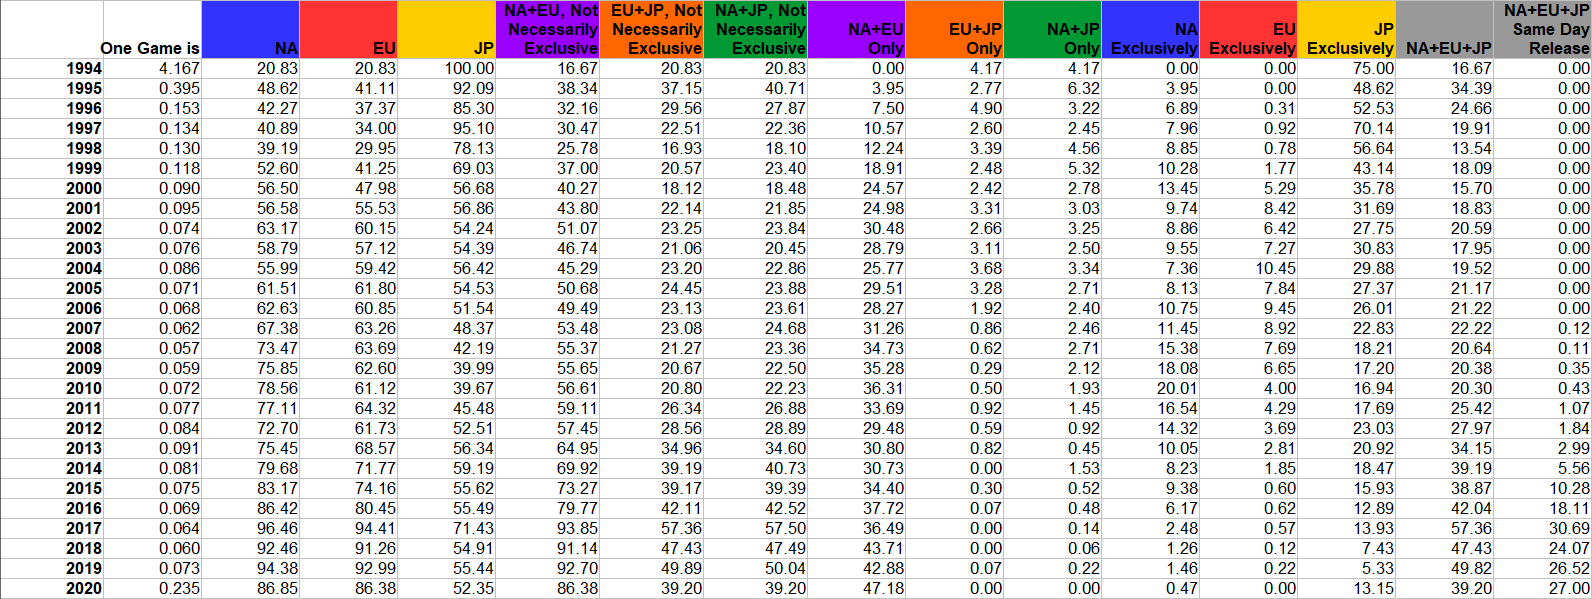
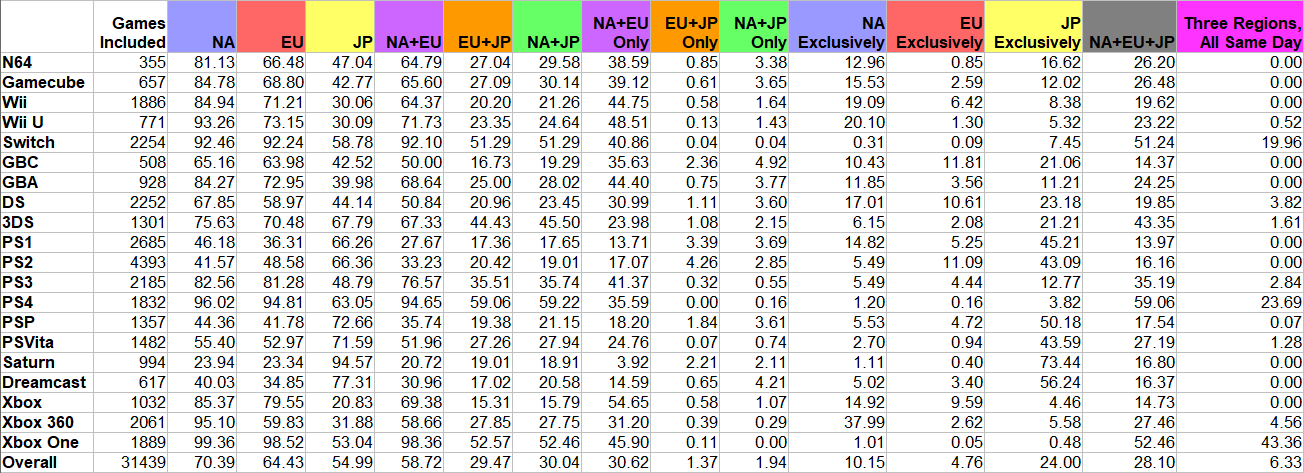
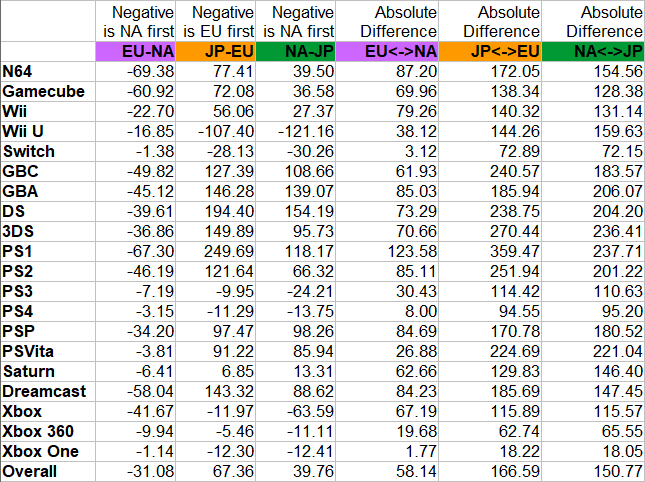
Here’s all the data for the regions by system. Unlike with the Nintendo project I included games not released in the big three regions, and there were a fair number for the PS2. European exclusives have always been rare.

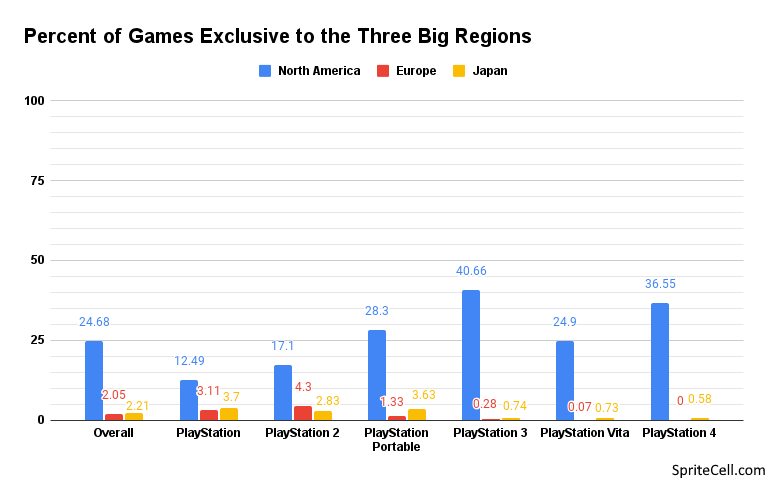
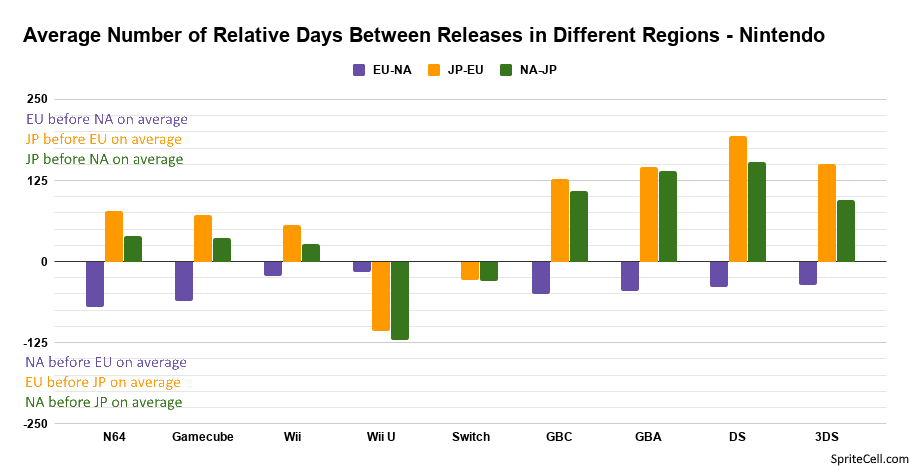
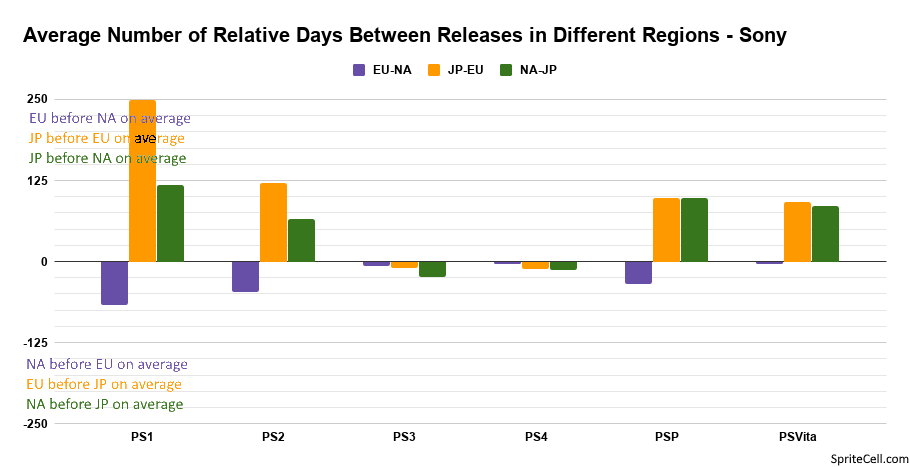
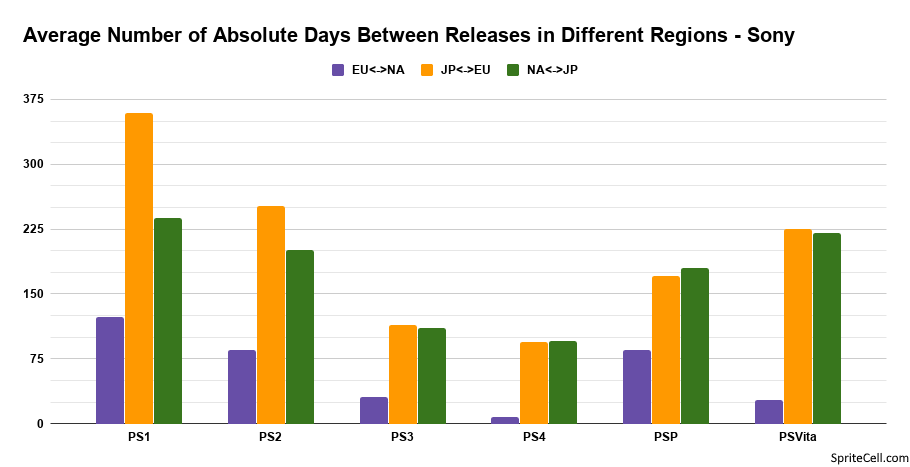
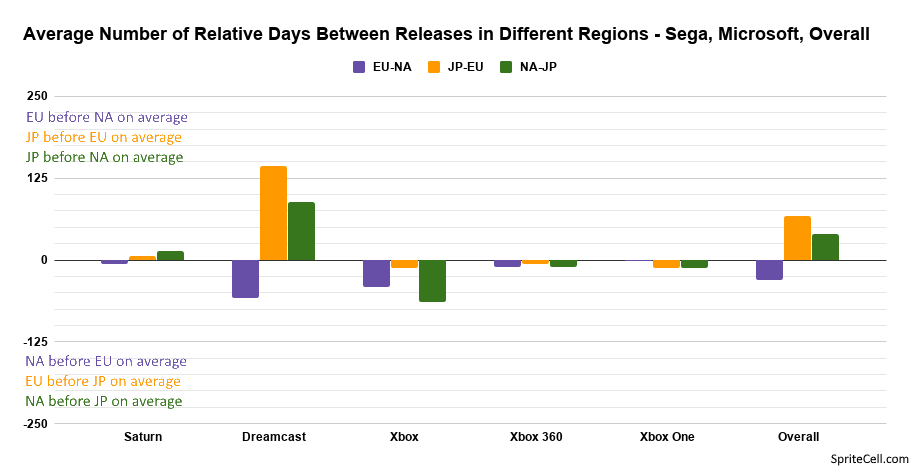
A more graphical way to look the data from the chart.
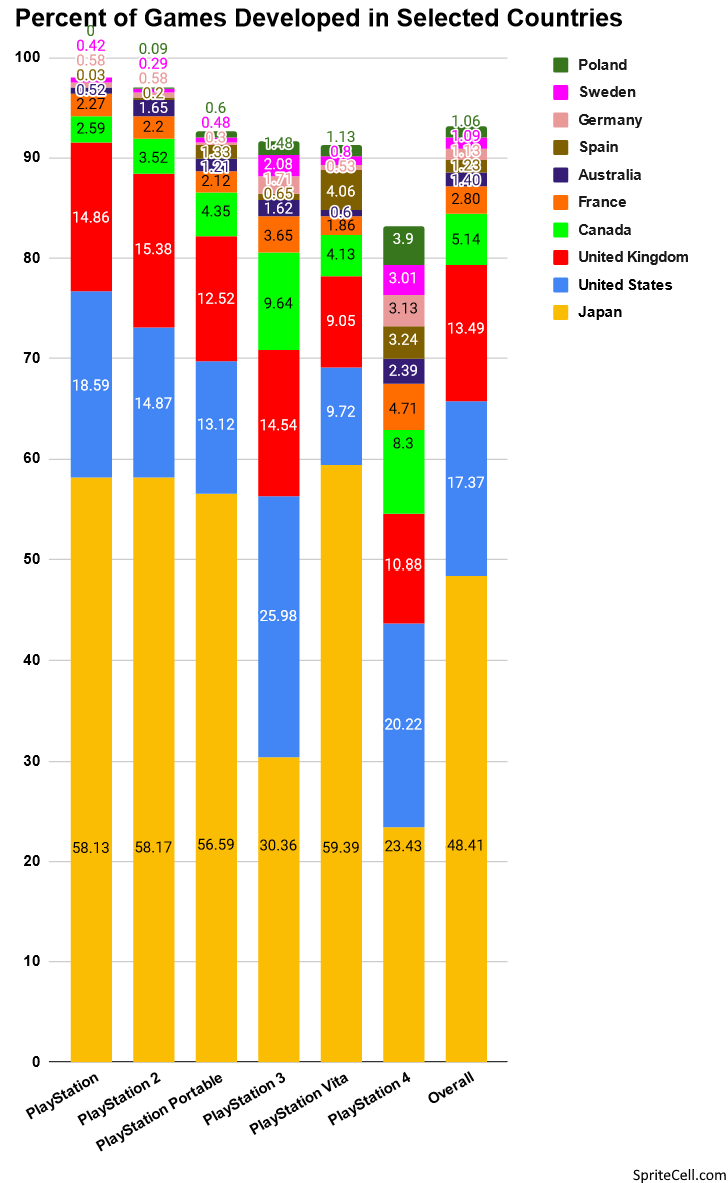
The 10 countries that developed the most games for Sony systems, and their share of all games released for each system.
Overall we have seen more and more countries develop video games over time, with the PlayStation 4 making a large jump.
We don’t often think of Canada as a powerhouse of game development, but several provinces provide tax breaks for game studios, and Montreal is home to many development studios, including one of the largest in the world, Ubisoft Montreal, while Electronic Arts Vancouver makes a lot of sports games.

It’s difficult to get a good color gradient for this map, since many countries have only produced a handful of games, but it is nice to see that game development has truly become a global effort.

This graph is a bit silly, and probably a bit hard to understand. What I wanted to find out was which countries had a lot of game developers per capita and which didn’t, but there isn’t that kind of data for many countries. Instead, this is how many games were developed in each country per person, as of 2020. So for instance, Japan developed 7,498 games in this study, and had 126,476,461 people, so it made 0.0000593 games per person. This is a bit cumbersome to read, so scientific notation is used. 5.93E-05 means 5.93*10^-5, or 5.93 with the decimal moved left 5 times, or about 6 games per 100,000 people.
Japan is clearly very dedicated to making video games, and second place, the United Kingdom, has about half as many games per person with roughly 3 games developed per 100,000 people. Malta may have only worked on 6 Sony games, but that is a lot for its population of 441,543. China, India, Pakistan, and Indonesia have large populations, but few games, putting them on the bottom of the list.
Developers and Publishers
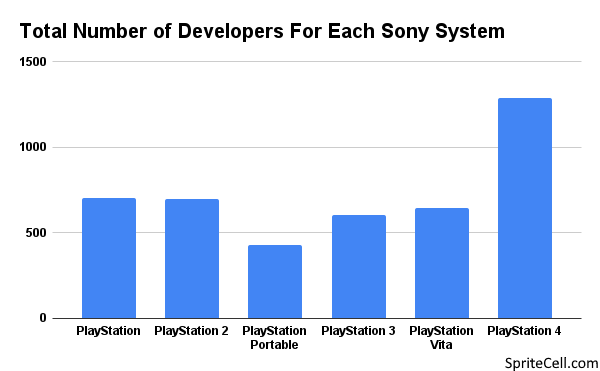

These graphs are very similar, but please note the y-axis is different on each.
I’m surprised the PSP has the fewest, it sold much better than the Vita, games were relatively cheap to make for it, and digital distribution had just begun, opening the way for smaller titles.
I would have expected the PS3 to have more developers and publishers as well, with the indie explosion in full force during its lifetime.
Self publishing has become a viable option for many small digital-only games, one cause of the large number of publishers for the PlayStation 4.
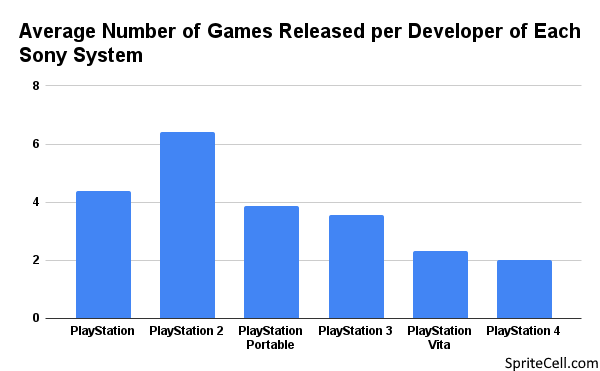
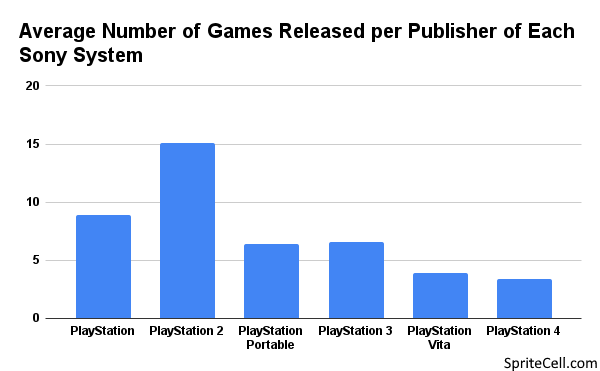
When we consider games per developer or publisher, things are a bit different. The PlayStation 2 was a huge hit and a lot of companies threw everything they could at it. Over 6 games per developer on average is incredible. Two generations later it was only possible to make a third as many.
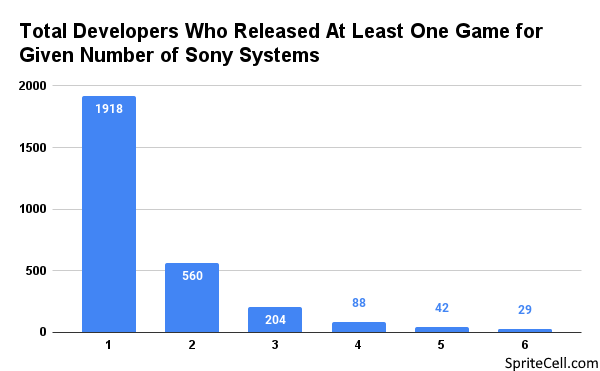
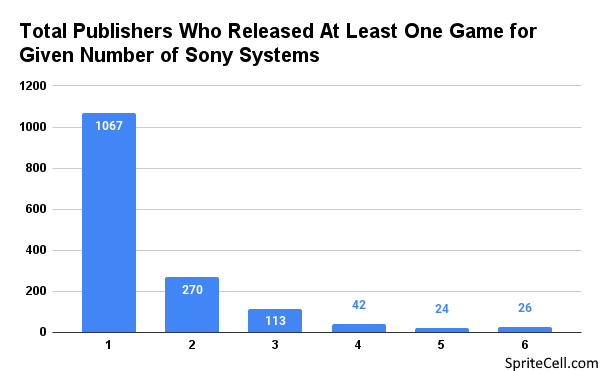
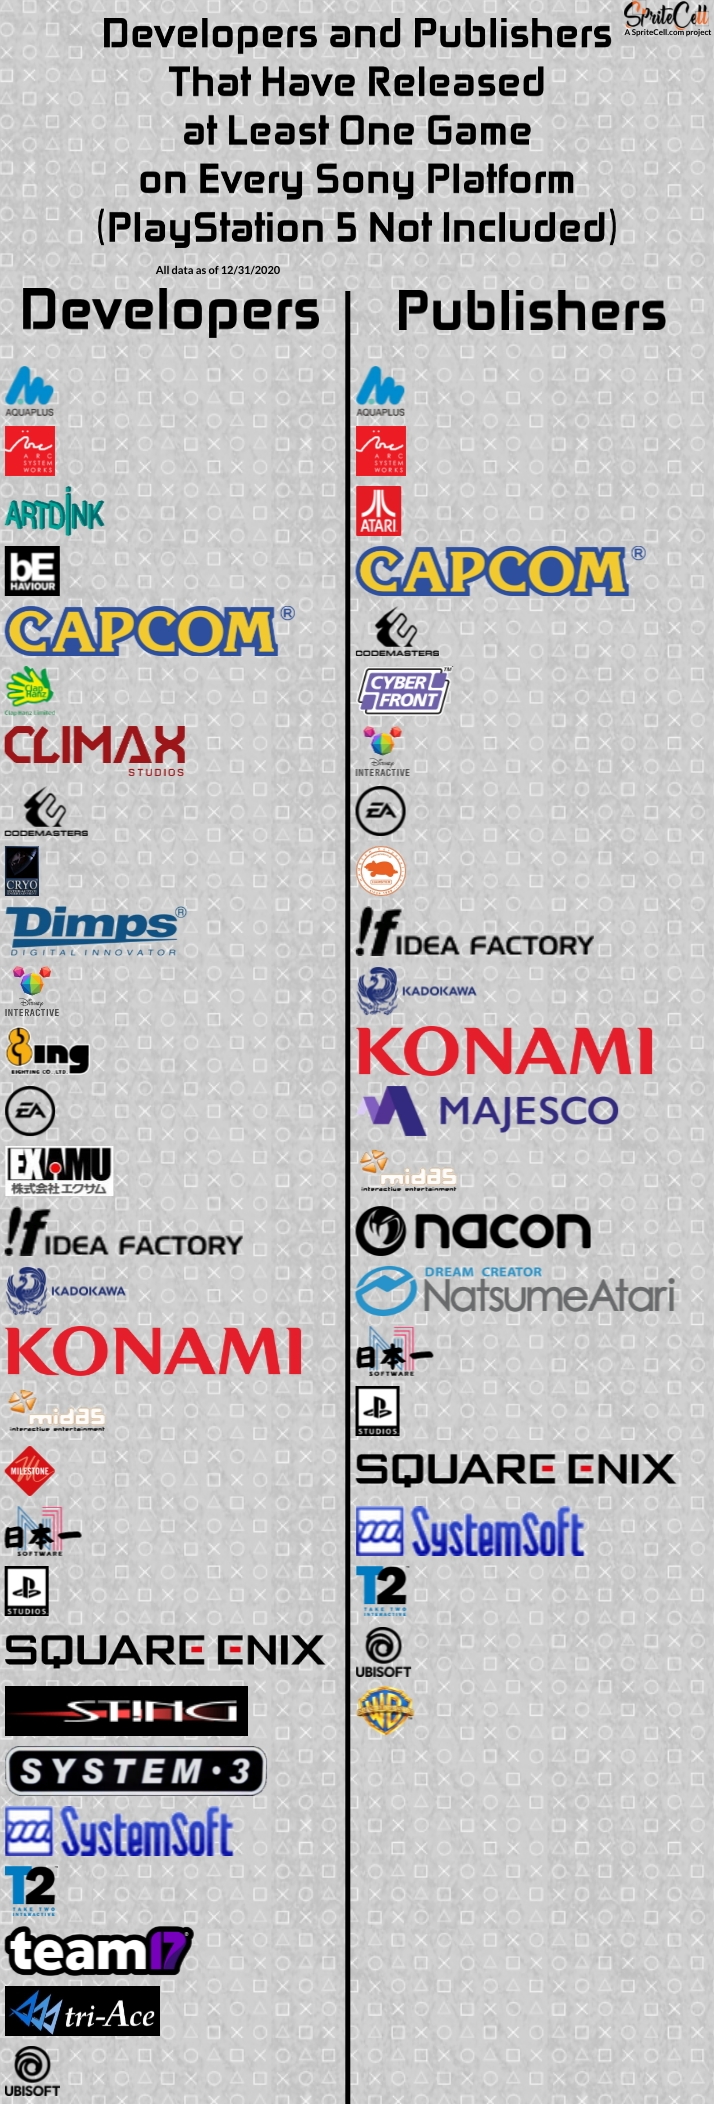
Here is a look at how many Sony systems developers and publishers supported. A great majority had short lives or didn’t stick around for more than one system. Twenty-nine developers and 23 publishers have released a game for every Sony system, and I will show you who they are soon. Nintendo has had 6 developers and 8 publishers if you omit the Virtual Boy and combine Bandai/Namco/Bandai Namco and Koei/Tecmo/Koei Tecmo.
I did not include companies before and after merger as one company for this, unlike the equivalent Nintendo chart. If I had Bandai/Namco/Bandai Namco, Koei/Tecmo/Koei Tecmo, and Sega/Sammy/Sega Sammy would have been included in both developer and publisher lists.
The usual suspects are here, but there are some lesser known companies too.
Nacon was known as BigBen Interactive until recently.
Behaviour Interactive, formerly known as Artificial Mind & Movement does of lot licensed games.
Very few of SystemSoft’s games leave Japan, but they have some long running series, including Daisenryaku, WWII era war strategy games.

Despite their shorter history Sony has both developed and published more games for their platforms than Nintendo. Konami is not far behind, once again showing its prolific output, it was the #1 developer and #2 publisher for Nintendo.
Idea Factory is not well known outside of Japan, yet claims fifth most prolific developer.
Electronic Arts and Ubisoft are the only non-Japanese companies in either top 10.
Lightspan is the only company to make this list that only supported one console, and 3 others managed it with only 2.
If I had combined pre- and post-merger companies as a single entity the totals would have looked like this:
Bandai/Nacmo/Bandai Namco: 519 developed, 1016 published
Koei/Tecmo/Koei Tecmo: 412 developed, 422 published
Sega/Sammy/Sega Sammy: 291 developed, 472 published
Square/Enix/Square Enix: 218 developed, 328 published

This graph shows the difference in the percent of games developed in each country between Sony and Nintendo. Negative values mean a country has a larger share of the total Nintendo games, while a positive value means Sony does. For example, 50.960% of Nintendo games were developed in Japan, while 48.409% of Sony games were developed in Japan. The difference is -2.551, indicating that a larger percent of Nintendo games were developed in Japan when compared to Sony. If a value is red it means that no Sony games were developed in that country, if it is black then no Nintendo games were developed there.
I have heard before that Nintendo is generally not as popular in Europe as it is in the United States. While that seems to be true of the United Kingdom, Poland, and Sweden if we are to judge by game development, it is not true of France, Germany, or Spain. These six countries are the European countries that developed at least one percent of all games for either company.

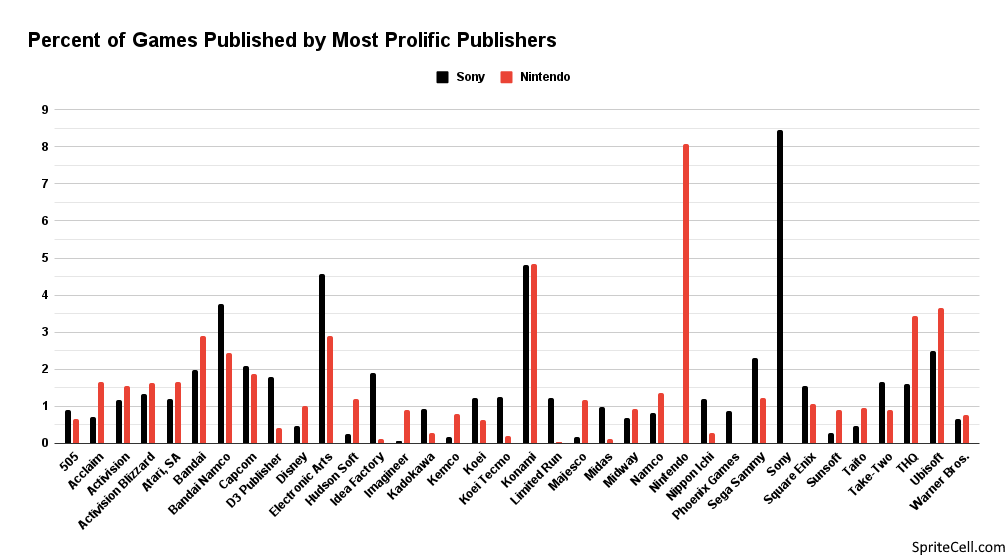
I also wanted to look in to which hardware maker different developers and publishers favored. The developers and publishers included are the top 25 for Sony and Nintendo, which has a lot of overlap. The percents are of Sony and Nintendo’s libraries, not the developer’s or publisher’s.
Please keep in mind the Nintendo data is a few years old, so Limited Run is probably very close between the two by now.
Electronic Arts, Koei, Koei Tecmo, Nippon Ichi, the newer SNK, Square Enix, and Take-Two are some developers making significantly more of Sony’s games. Hudson Soft, Intelligent Systems, Kemco, and TOSE are some that make many more Nintendo games. TOSE likely just got credited less often by the time Sony entered the game, however.
There is a huge gulf in the share of Sony developed games and Nintendo developed, that is made only slightly more even when considering HAL Laboratory, Intelligent Systems, and other not-owned-by-Nintendo-but-work-almost-exclusively-with-them developers.
It is striking how Konami is the first or second biggest developer and publisher for both Sony and Nintendo and also manages to represent almost the same share of both libraries, especially since few of those games released on both a Sony and Nintendo system.
On the publishing side Sony and Nintendo are much closer.
Game Titles

All game title data uses North American English localized names when they exist, European English names when they don’t, or Romanized Japanese names when neither exists.
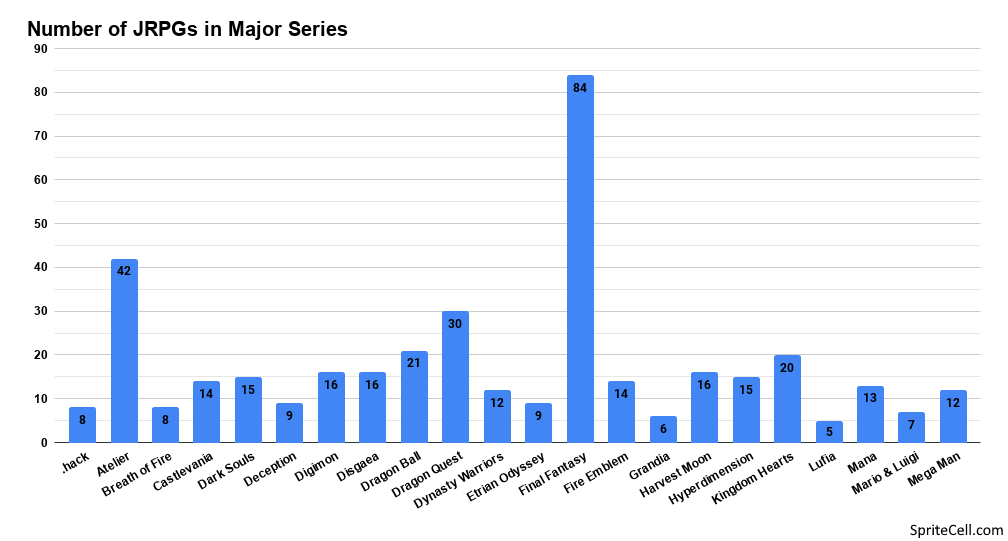
I wanted to try this word occurrence graph again with some different words. This time I included roman numerals preceded by a space, to get a better idea of how long some series tend go on for. This is somewhat hampered by games with a space followed by a new word that begins with I or V. Final Fantasy XV is the only roman numeral-ed game that has gotten to XV.

PlayStation 2 and PlayStation Portable games had the longest titles, while PlayStation 4 saw quite a reduction in title length. This chart correlates fairly closely with the number of Japanese exclusives, which can be quite wordy.

The shortest games titles were D and Z, both for the PlayStation. There is also a game called X for the Game Boy.
The longest title was Hisshou Pachinko*Pachi-Slot Kouryoku Series Vol. 5: CR Shinseiki Evangelion 2nd Impact * Pachi-Slot Shinseiki Evangelion, with 120 characters. The exact title varies a bit by source, but every way I saw it rendered easily put it at the longest title.
Thirteen is the most common length, with a gradual drop off as titles get longer.
In closing
This project took a lot longer to make than I expected it to, even with the knowledge I gained making the Nintendo Games Project. I made fewer infographics for systems, but a lot more graphs covering different kinds of data. Not having to fix and research a lot of data for games from the 3rd and 4th generation helped speed things up somewhat.
I don’t see myself ever making a Sega or Microsoft games project, they just weren’t/haven’t been around long enough as hardware makers.
I hope you enjoyed this project and learned something interesting.
Sources
MobyGames – Genre information
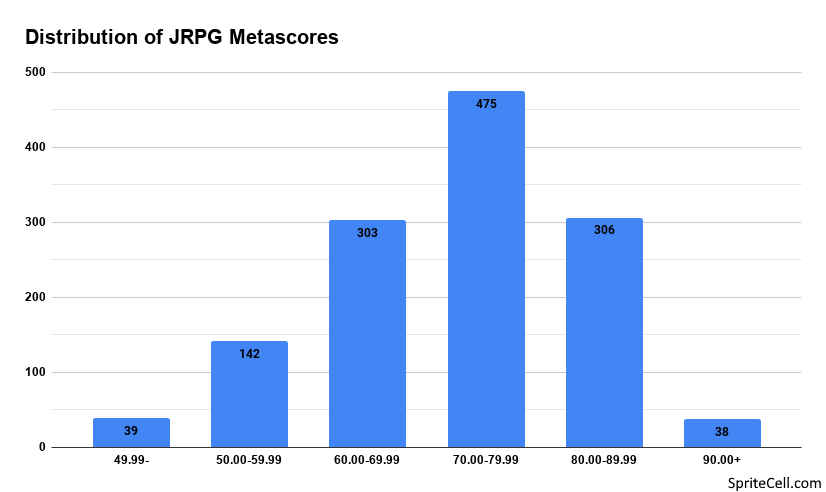
MetaCritic – Metascores
ESRB – ESRB ratings
List of best-selling video games by platform – Lists of best selling games
Lists of video games – Lists of games for each system