Most games that sell at least a million copies make some sort of an announcement to celebrate. This helps the game sell more copies as it makes more people see it as a worthwhile game. It’s a significant psychological milestone. Some big franchises can depend on always selling many millions, but for an indie studio it could be a huge success. But what sets these best sellers apart from other games?

For this study I tracked down every game I could that had claimed to sell at least a million copies among all platforms it released on, and how many. I added the data from my 25 Years of Games project, namely the (first) release date, the metascore (when available), the genres, the main story and completionist time, the ESRB rating, and any ESRB content descriptors.

I found games to include by grabbing everything from wikipedia lists like List of best-selling PlayStation 4 video games, and doing general google searches for best selling lists of other systems that don’t have such lists (as long as there were good sources), then I searched the Games subreddit for “million” for more recent multiplatform games, and finally I looked through lists of games for any titles that I thought could possibly have a big enough following to sell a million copies and looked through their wiki pages for sales numbers. I also looked through many pages at the Video Game Sales Wiki, being careful to check sources.

This ended up being 1,306 games starting from all the way back in 1979. There are many more million-sellers out there, but sometimes numbers are not announced even when a game has clearly sold more than 1 million copies. There is a recent trend of huge franchises not announcing sales numbers, such as Call of Duty and Madden NFL. I didn’t want to use estimates so I could not include them. There are also likely many games released on 3 or more platforms that sold just over one million total but were never reported as such.

Another issue is that the numbers released have become less detailed over time. Some earlier games reported numbers down to the thousands place, while now it is more common to only see the hundred-thousands place, or just “one million”.

Arcade games, one-game systems, and mobile games were not included.

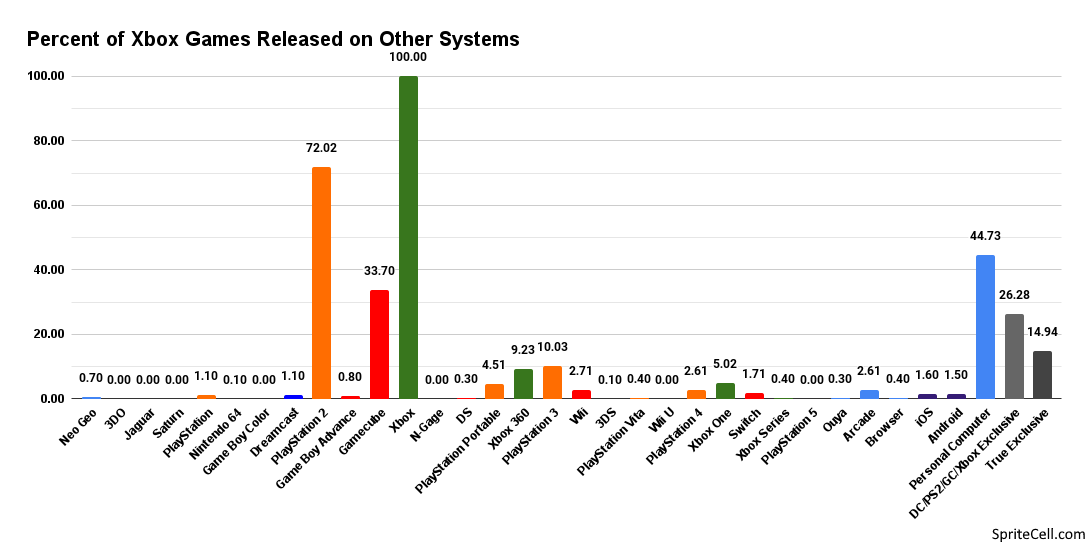
Games released for multiple systems (52% of the total) were combined into one entry. Sometimes this led to “are these different versions distinct enough to be separate entries?” issues that I just had to do my best with. I used data for the first release of a game, even if its remake many years later sold more copies.

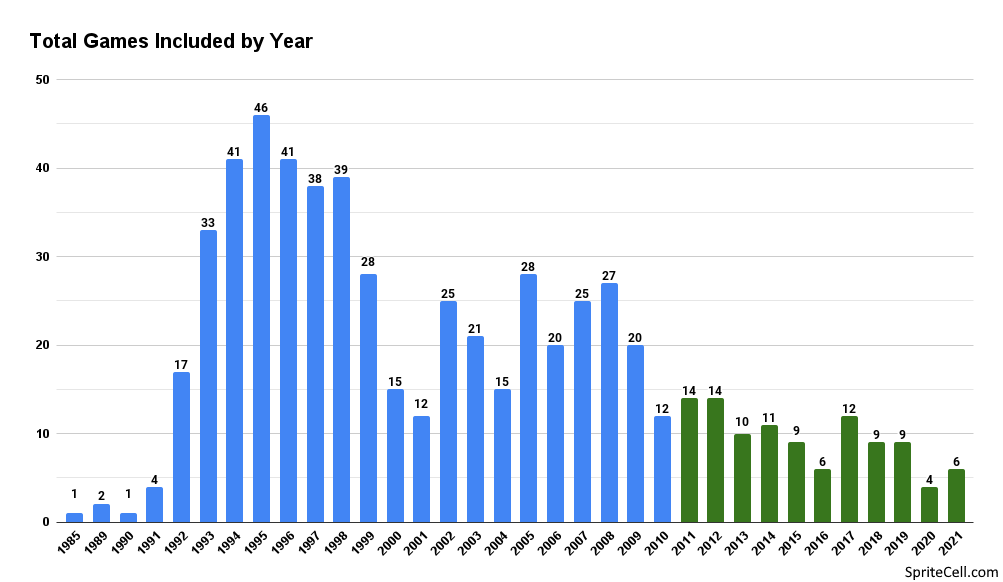
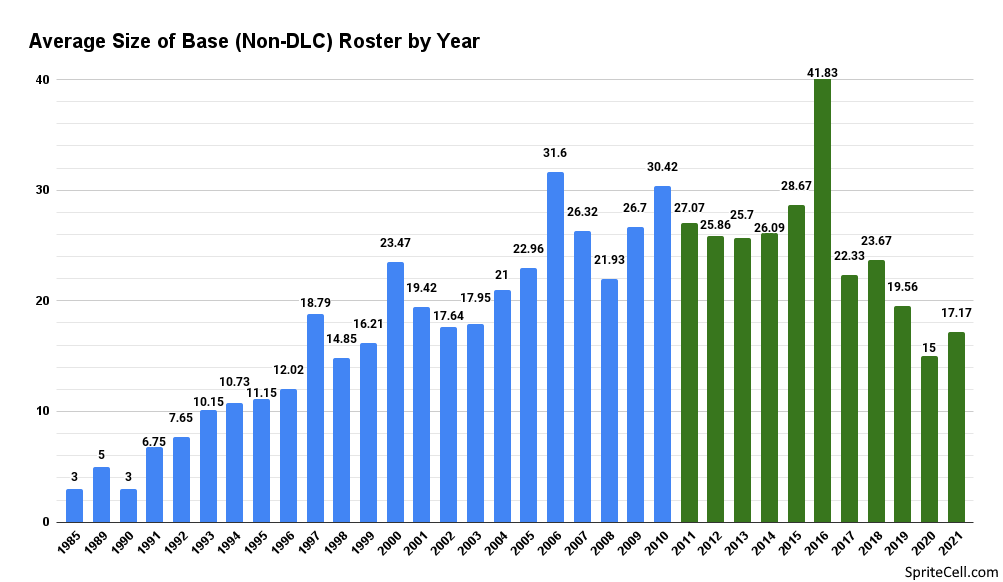
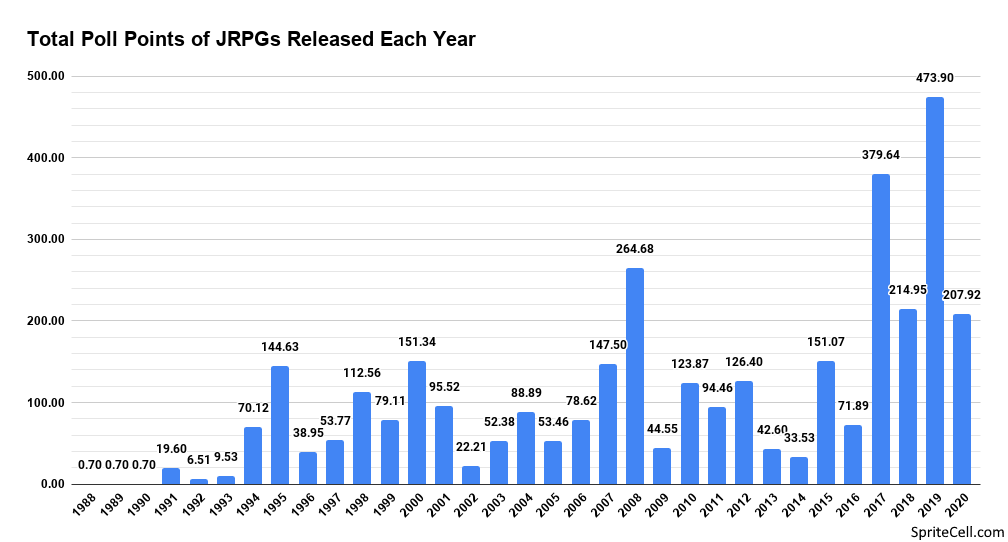
Million-Sellers by Year

So what was the first game that was released on interchangeable media to sell a million copies? It appears to be Las Vegas Poker & Blackjack on the Intellivsion, released in 1979 with about 1,939,000 copies sold. However, according to the Wikipedia page for Space Invaders there is a book by Brett Weiss that claims Space Invaders was the first. Space Invaders wasn’t released until 1980 on the Atari 2600, though. It is possible that Las Vegas Poker & Blackjack took longer to sell one million copies even though it released first, but we will likely never know, and for the purposes of this study I am only considering the release date, even if it took many years for a game to cross the million-seller threshold.

There’s a big climb in the late 90s as video games become more and more mainstream, but starting from 2013 the number declines. This is partly due to publishers releasing fewer sales numbers, and partly because newer games have had less time to rack up sales. But even with those factors, it still seems like too much of a drop to me and I don’t know how the reason why there aren’t more million-sellers in the last few years.

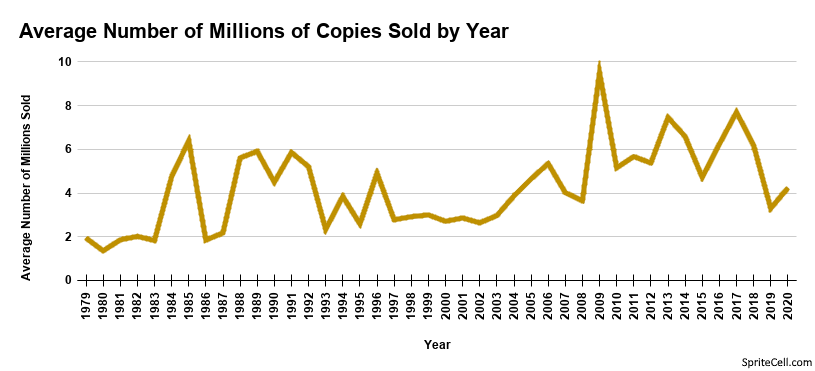
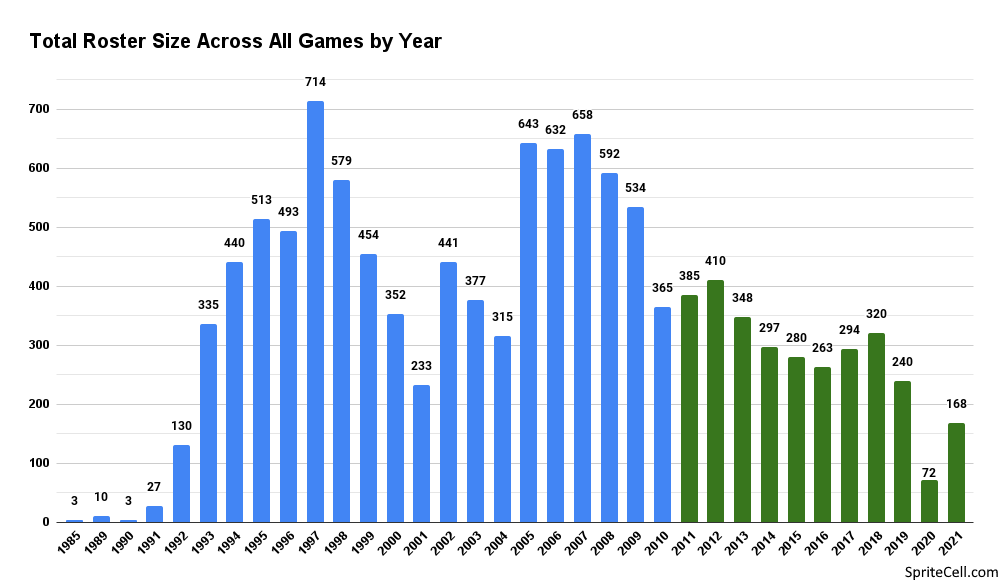
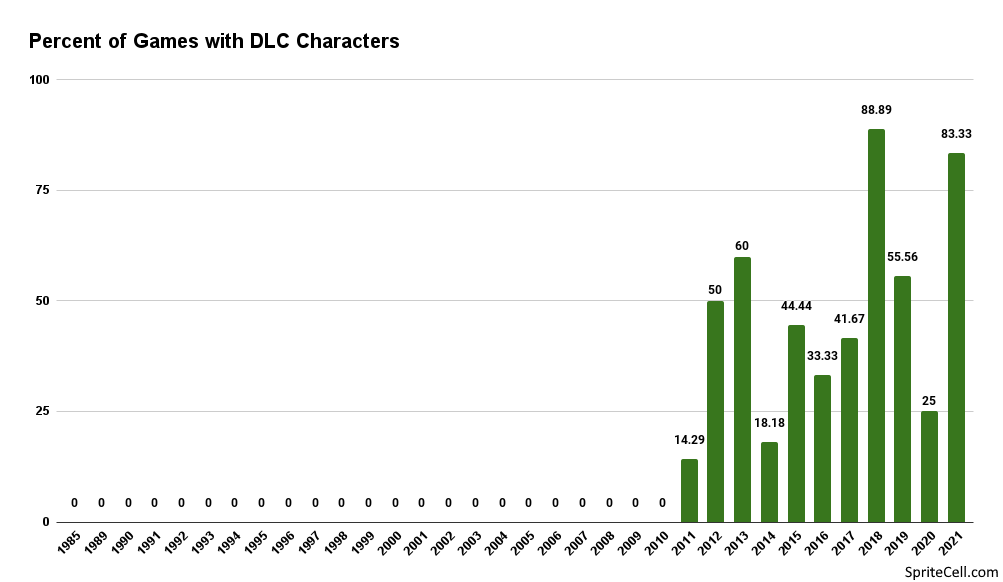
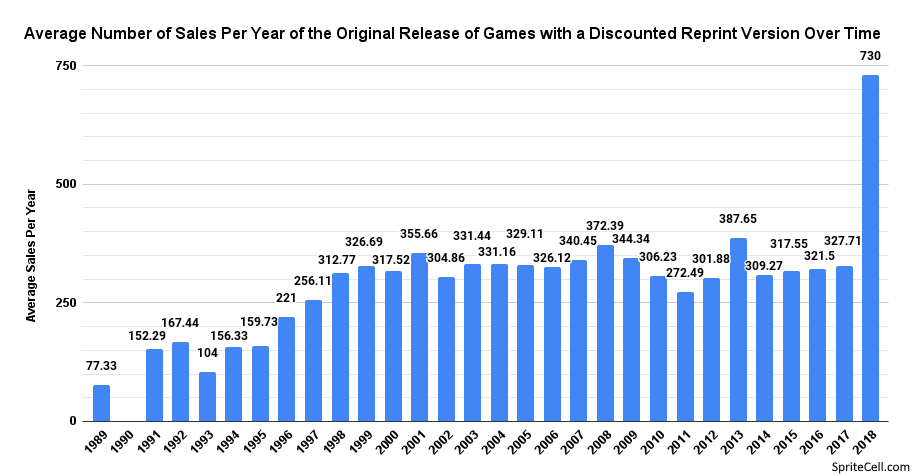
This is the average number of copies sold among million-sellers, please note that many of these games took several years to sell as many copies as they have and that this is only by initial release rate. Can you guess what game that has sold over 200 million copies is responsible for the spike in 2009?

The 2013 dip isn’t noticeable here. Likely caused by fewer games selling more copies.

Million-Sellers and Metascores

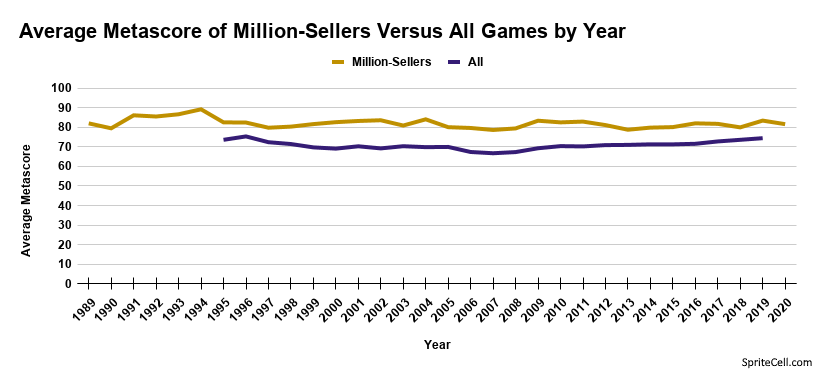
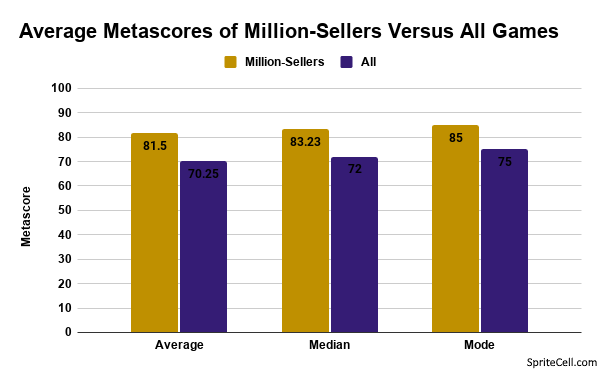
Metascores, obtained from a mixture of Gamerankings and Metacritic, are sparse before the year 2000, so their average will be less accurate. If you really want all of the details check out my metascore project.

We generally assume that games that sell well are of high quality and enjoyed by the people that play them, and this seems to pan out in the numbers. Million-sellers have consistently outscored the overall average, though the margin has shrunk over time.

Million-Sellers and Genre

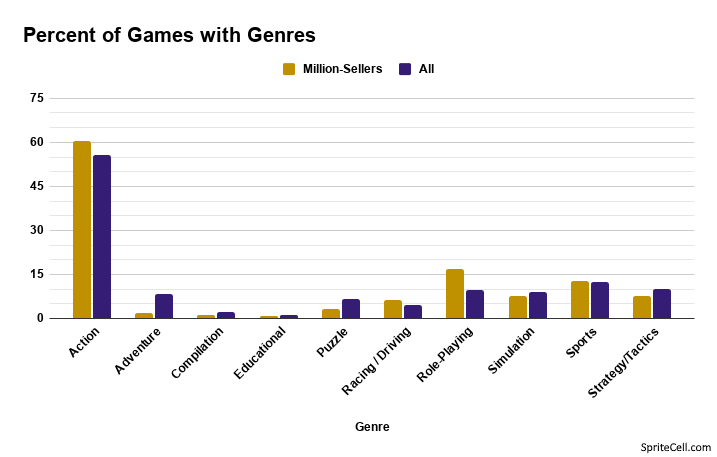
Million-Sellers are more likely to be Action, Racing/Driving, or Role-Playing games, but the differences are never very large. For more on why just these genres are being recorded and for more details, check out the genres portion of the 25 years of games project.

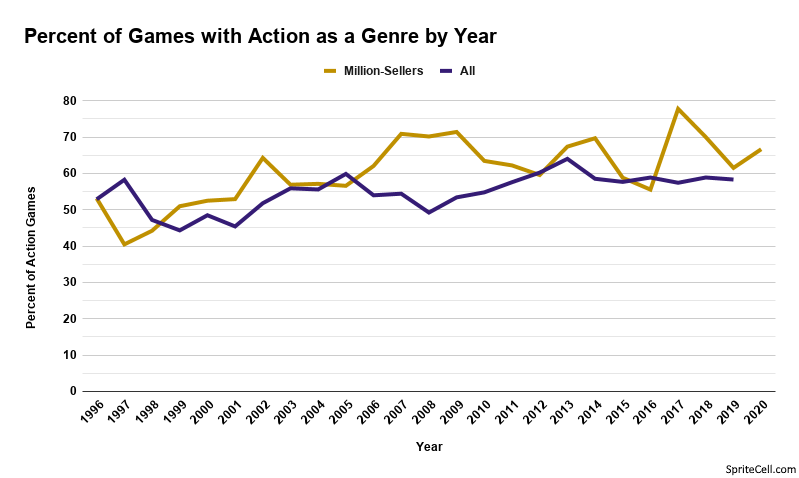
The next genre charts will have different Y-axis scales, so please keep them in mind. I also have data going farther back for the genre of million-sellers, which was used for the overall graph above, but I have started the line graphs at where my “all games” data starts.

While million-sellers are more likely to have Action as a genre, there have been years where it was less relatively successful.

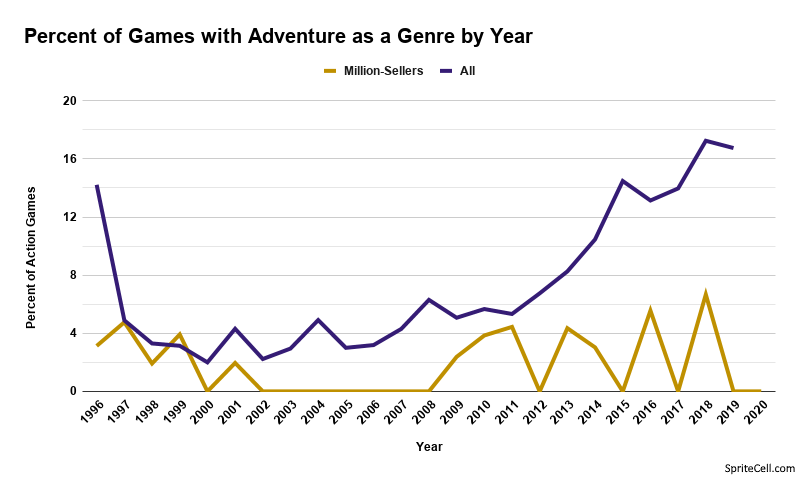
While Adventure games have seen a renaissance in the ’10s, ever fewer sell a million copies. For some Adventure games it was unclear what combination of individual chapters and whole-series packs make up reported sales numbers, so I could not include them.

Very few Compilations reach the million-seller mark, with many years having none at all.

There have never been many Educational games, but it has seen a few million-sellers. The first to do so was Where in the World is Carmen Sandiego? Also in this genre are Art Academy, Mario Paint, Wii Fit, and Ring Fit Adventure. Carmen is the only one not exclusive to a Nintendo system.

Fewer and fewer puzzle games burn up the charts as time goes by, but Clubhouse Games managed to in 2020.

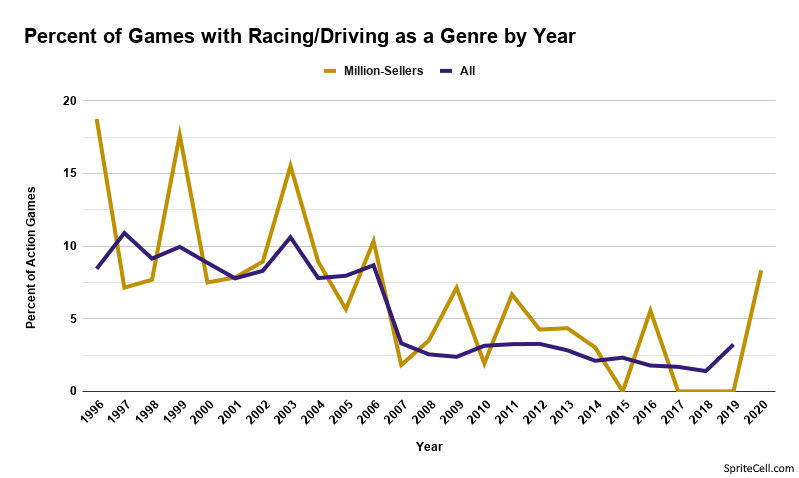
Racing/Driving games have become less common in general over time, both among million-sellers and in general.

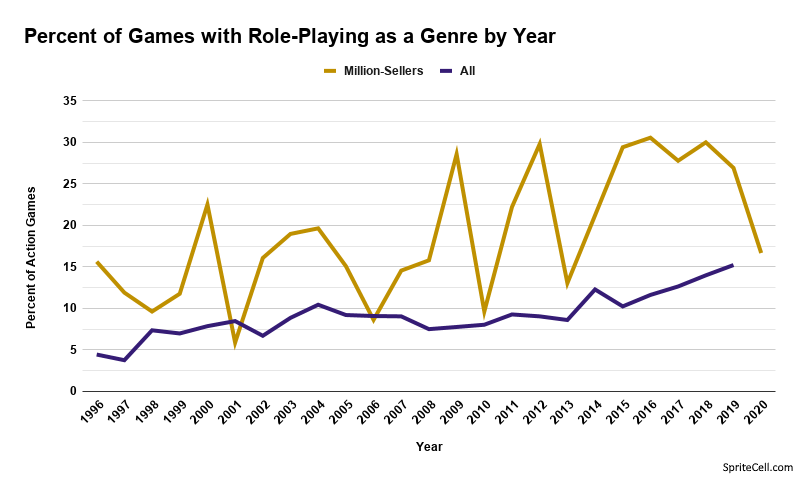
A way to add depth to a game is to add some Role-Playing mechanics, and publishers have been keen to do so as so many sell above average.

The most eclectic genre doesn’t seem to have much impact on sales.

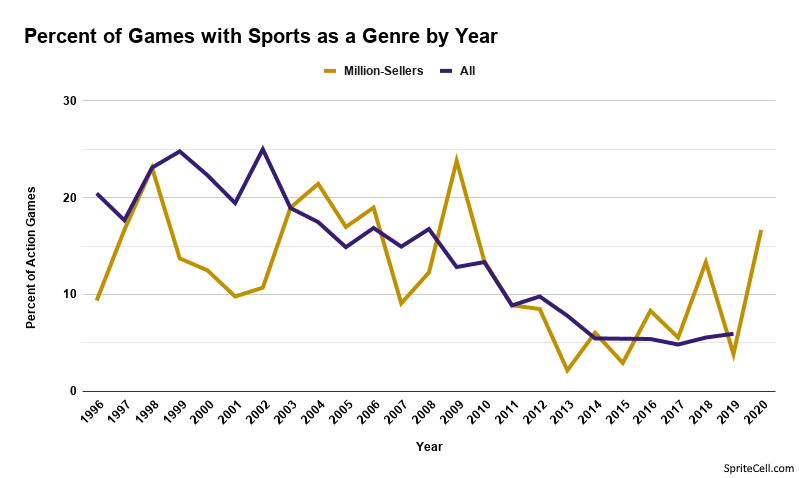
Many Sports games don’t get their sales numbers released anymore, otherwise I would expect it to be more prominent among million-sellers, even as fewer Sports games are made.

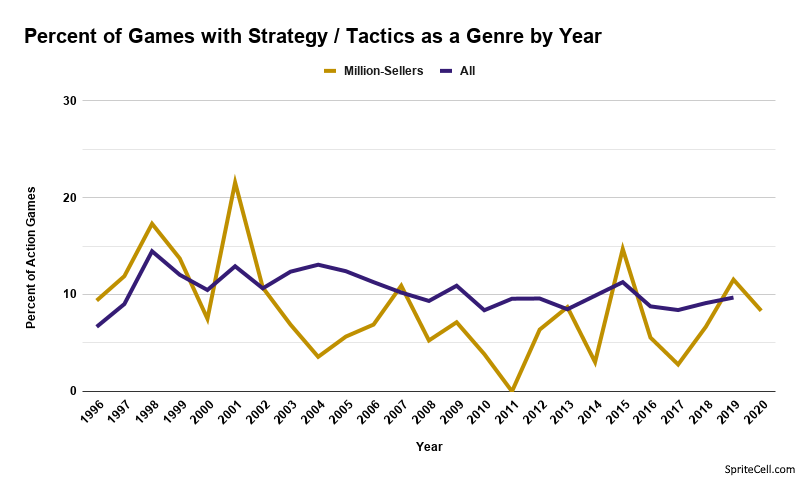
For the last few generations Strategy / Tactics games have had a smaller proportion of million-sellers.

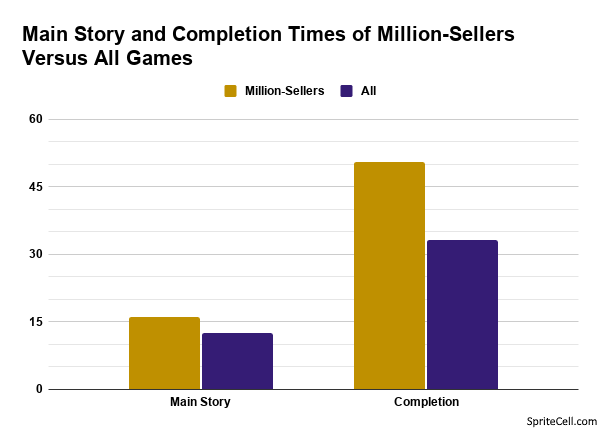
Million-Sellers and Game Lengths

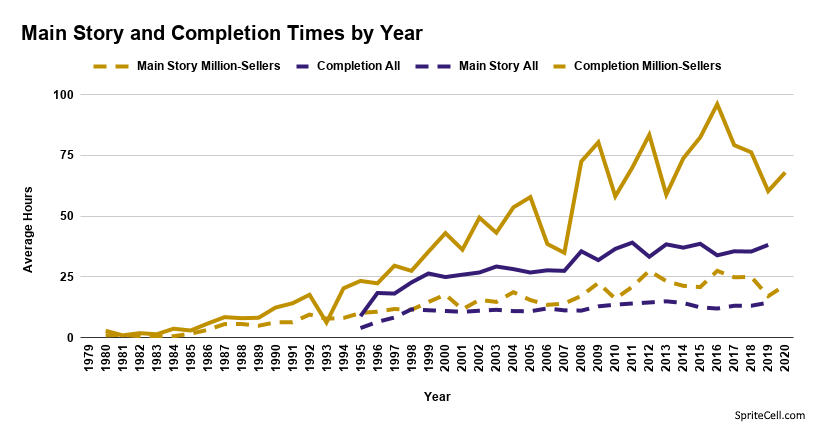
More information about what these times mean and how the data was acquired is available in the game lengths page of my 25 years of games project.

While games have become longer over time, million-sellers have always been longer than most other games. This has been especially true for completion times in the last decade. The most successful games tend to have bigger budgets and can include more content, but people may also be biased towards longer games, looking to get as much time out of their dollar as possible.

Million-Sellers and ESRB Ratings

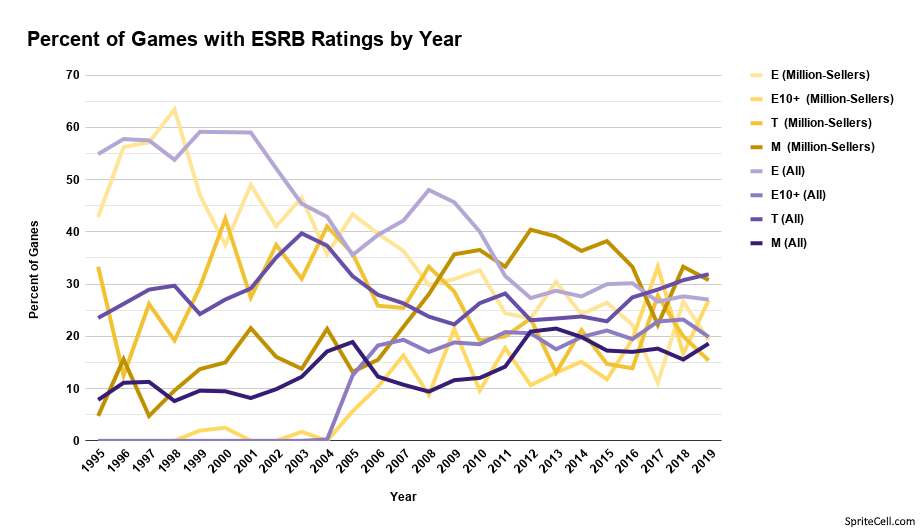
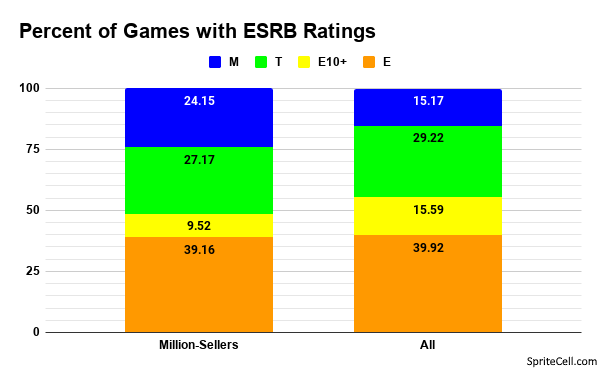
Not all million-sellers have ESRB ratings because many were from before the ESRB existed, or computer games that never got one, but it was a requirement to be included in my 25 years of games project. For a more direct comparison the stacked bar chart only includes million-sellers with ESRB ratings, while the line chart includes those without one. There are a few million-sellers with the Everyone 10+ rating before it existed because of games getting later releases after it had been introduced, and I recorded games by the first release date. More on ESRB ratings here.

No million-seller has had an Early Childhood or Adults Only rating, so they are not included.

Million-sellers are just a bit less likely to be rated Everyone, Everyone 10+, or Teen, but more likely to be rated Mature.

Million-Sellers and ESRB Ratings Descriptors

I’ll be breaking the descriptors down by category, and please be aware that the Y-axis will be vary significantly. An exhaustive survey of every ESRB descriptor can be found here.

An odd mixed bag with substances. Tobacco is less common in million-sellers, while drugs are more common, and alcohol portrayal depends on if it’s a reference or someone is seen drinking it.

Different types of violence are overall pretty similar, with a few exceptions. Fantasy Violence is much more common in million-sellers, while Intense Violence is rarer.

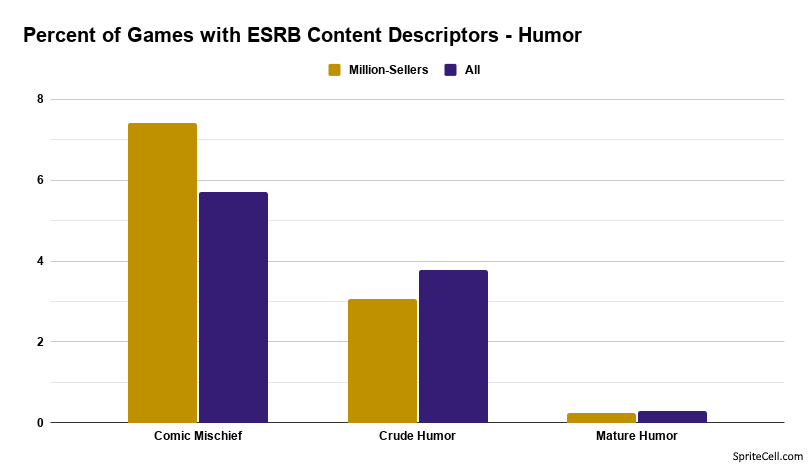
A bit more Comic Mischief in the most popular games, but not much more.

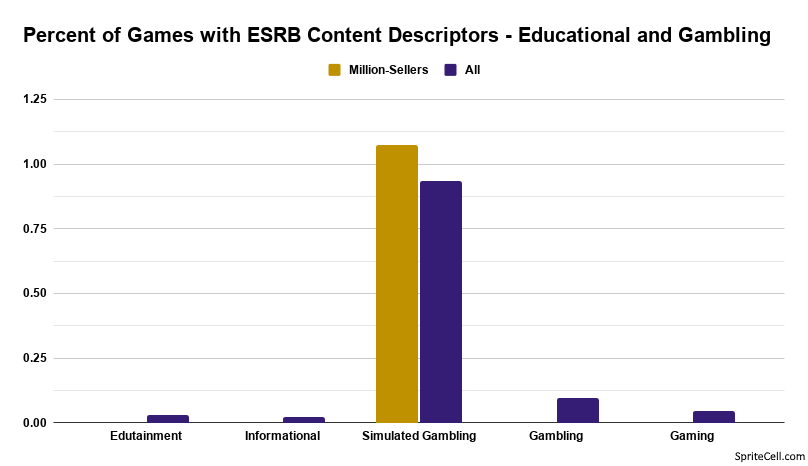
A few rare and short lived descriptors have never been seen on a million-selling game.

I would have expected all of these to be significantly more common in million-sellers, since licensing music and hiring voice actors costs money, and overall not many games have either. The best sellers sure like using the worst of the swear words, though.

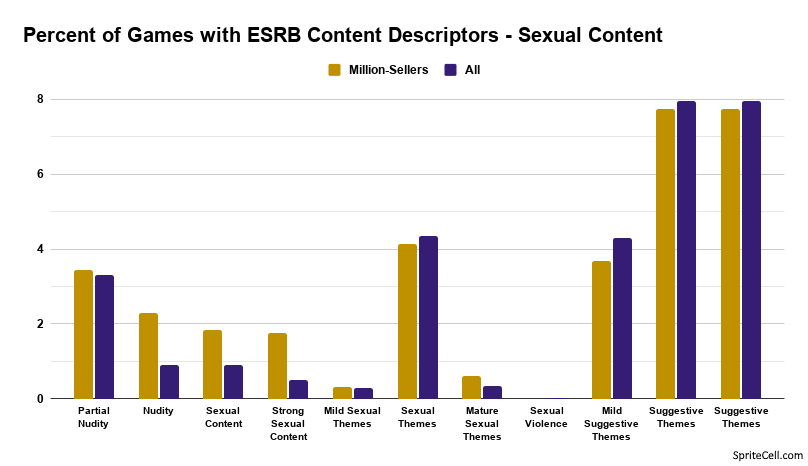
Interesting that Nudity has such a disparity compared to Partial Nudity. Only a few descriptors here have a significant difference.


Trivia

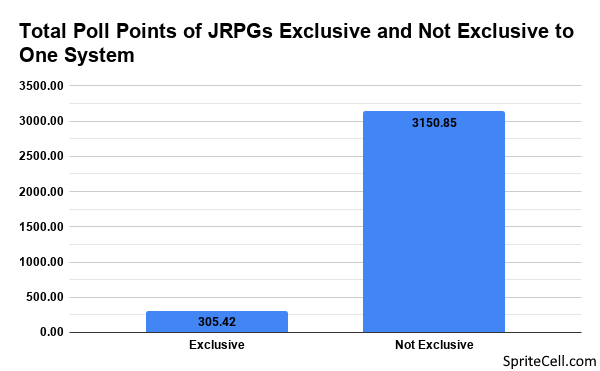
About 39 of the million-sellers were exclusive to Japan (I didn’t exhaustively check regions), all the way up to a couple 3DS games. I believe the only European exclusive was Dancing Stage Party Edition.

One 3DO game may have sold a million copies even before it became a pack-in: Gex, although this number is somewhat disputed. I could also only find evidence of a single Sega Saturn game selling a million copies: Virtua Fighter.

The million-sellers with the lowest metascores are Game Party and Game Party 2 for the Wii, with a 22.6 and 31.9 respectively.

To receive a Metacritic metascore a game has to have at least 4 reviews. Occasionally even million-sellers don’t reach this threshold. These are mostly exclusively for PC: Satisfactory, Stickfight: The Game, Just Survive, The Legend of Sword and Fairy 5, and Garry’s Mod are some examples. But only a few non-PC games from after 2000 have managed it: Zumba Fitness for the Wii, English Training for the DS (Japan and Europe only), and Dancing Stage Party Edition (Europe only).

Sources

Game data

GameRankings.com Archived Score Browser and Metacritic for metascores

HowLongToBeat.com for game lengths

ESRB.org for ESRB ratings and rating descriptions

MobyGames.com for genres and some miscellaneous information

Xbox Addict for some information about regionality

Sales Data

https://vgsales.fandom.com/wiki/Video_Game_Sales_Wiki

http://www.capcom.co.jp/ir/english/finance/million.html

https://www.pcgamesn.com/civilization-6/sales

https://www.reddit.com/r/Games/search?q=million&restrict_sr=1&sort=new

https://www.pcgamesn.com/civilization-6/sales

https://venturebeat.com/2020/02/06/red-dead-redemption-2-surpasses-29-million-copies-sold/

https://www.playstationlifestyle.net/2020/04/08/the-witcher-3-sales-28-million-units/

As someone who buys a lot of used video games, especially from older generations, I have long wanted to know how game prices change throughout the year. Do they tend to decrease and increase at predictable times of the year?

If you search for the answer to this question you will find many articles that are more about new and currently popular games, which mostly suggest looking for deals on Black Friday, or perhaps in January. That doesn’t really apply if you’re looking for something more than a few years old.

So in late 2018 I made a new account on PriceCharting.com and added 50 complete in box games from 23 systems to my “collection” so I could track its price; a sort of price index of 1,150 used games. Every morning at just about the same time I recorded the value of the collection. The systems I included were the North American versions of everything from Nintendo, Sony, Sega, and Microsoft, but not the most current systems at the time (Switch, PS4, Xbox One), or some small and short lived systems (Virtual Boy, Sega CD, Sega 32X, Sega Pico). The newest system’s games weren’t included because their prices haven’t stabilized. I chose the 50 most “popular” games for each system on the site, the games that were getting price checked the most.

I excluded all games that cost over $200. My thinking is, games over this price are being searched for because they are known to be rare, and people are curious about how high the price is now, are looking to complete a collection, or are looking to buy games that they suspect will go up in value, not that they are personally interested in playing. Perhaps I should have set the threshold higher or lower, but I think this was useful in not letting speculative market manipulation have an outsized impact, and to keep the data more useful and practical for more people.

That said, two years later 59 games now had a value of over $200. Most notably, as of this writing, Kuon is selling for $564 on average when complete. Pokemon Crystal, Emerald, and Sapphire also rose over $200. No games from the 7th generation rose to this price.

There were a few anomalies with the PriceCharting site. Twice a game was removed from my collection, and I assume from the site. I didn’t keep a list of every game included so I have no way of knowing which these were. There were also a few days where the total value of the collection changed by less than a dollar, which probably means that sometimes the site didn’t update prices for an extended period of time.

I was initially just going to do one year. Then in early 2020 thought I maybe two years would be good for a comparison, but I wasn’t sure I wanted to keep recording. Eventually it became pretty clear that the pandemic was going to be a big thing and that there wasn’t going to be a nice comparison year, but a year that should be interesting in its own right.

The Data

Please note that the Y-axis does not start at 0, which makes the change from highest to lowest look more dramatic.

On January 1st, 2019 the average value of a game from the included systems was $40.59, and on December 31st, 2020 it was $61.68.

Assuming 2019 is a typical kind of year that we may return to in 2022 and beyond, prices grow most quickly in February and March, continue to grow in April and May, and then decrease or grow very slowly June through November. I’m quite surprised November was the biggest decrease in price. There’s a lot of Christmas shopping in both November and December, yet the change between these months is the most dramatic of the year.

2020 starts much like 2019, but in March people realize they will be spending a lot of time at home and game prices spike, hitting a high in May, and not approaching pre-pandemic price changes until October. November again sees the largest price decrease of the year, but it’s an even larger swing.

While prices have begun to shrink a bit, we’re still a long way from pre-pandemic. I don’t expect prices to get anywhere near what they used to be, or for the price decreases to last much longer. We just experienced an unprecedented surge, but game prices have always increased over time and I don’t think anything will stop that.


I found a bunch of interesting and goofy stuff in all of those NES manuals I looked at, so I wanted to make a separate post about them.

Nintendo Seals

Not only did Nintendo Seals of Quality have an oval and circle variant, but their colors varied quite a bit. While most used the same bronze-ish gold color no matter what colors the rest of the manual had, there were exceptions.

Controller Diagrams

While some controller diagrams looked like the real thing, others looked quite amateur and had odd details added. Also watch for the many names of the D-Pad.


This last one is for Donkey Kong 3. Many early Nintendo games used this “he [verbs]” wording in their manuals.

Notices and Advisories

Game Pak Precautions

I wonder why this wasn’t the same notice in every manual, there was clearly some points that Nintendo wanted to stress, but with everyone writing their own version some are poorly worded or miss some details.

It’s quite a shock to see Game Paks referred to as “cassettes”, and the NES as a “computer” in some of these, Nintendo couldn’t have been happy about that.

It bothers me more than it should how often there are multiple warnings per number/bullet point.

Rear Projection TV Warnings

It’s interesting how often this is phrased as “Nintendo recommends…”


Enemies and Items

I found some interesting and amusing descriptions and drawings of in-game things. A heart that doesn’t look like a heart, a lamp character, some bizarre descriptions of Muppet characters, and some awful puns.

Miscellaneous Things

Some of these have interesting takes on game difficulty, quite different from today. Others have some poorly drawn game screens, slang guides, or careful descriptions of what pausing is. Ads for candy, movies, even a chess magazine. There’s even the only “righteous babe” and ESRB rating you’ll see in an NES manual.

Sources

DigitPress was the source of most of the manuals. A few were from ReplacementDocs too.

Wikipedia’s List of Nintendo Entertainment System games.

FLickr user bucky for some higher quality scans, including a color version of Faxanadu.

The NES era was still a wild, experimental time for video games with very little standardization. The medium was still new and there were no internet forums and few magazines so developers often just kind of did whatever came to mind.

Manuals were no exception, with widely varying sizes, formats, and contents. I wanted to examine these early game manuals not just to learn more about the games of the time, but to see how different companies approached how to teach players about their games, what kind of wording they used.

This study includes the manuals of 675 Nintendo Entertainment System games released in North America, just shy of the 677 officially licensed there. Going in to this project I assumed the preservation of these manuals, belonging to one of the most influential and nostalgia-ridden video game systems of all time, would be set at a high standard. Instead, many of the scanned manuals were in poor shape, scanned at low, nearly unreadable resolutions, have missing pages, or were scanned in black and white despite the manual being in color. There are several websites hosting the same set of manuals, and although I did my best to find alternate, superior scans, I found myself having to just put up with a fair amount of incomplete data. Some games had multiple versions of their manuals, I used the last one in this case.

I’m going to be breaking down several metrics by year, so it’s important to know how many games were released each year. Keep in mind that 1985, 1986, and 1994 all had few releases, so averages are less reliable. All games from 1985 and about half of 1986’s were published by Nintendo.


Manual Length

To start off, how long were NES manuals? I included the front and back cover as separate pages. Manuals get longer over time, perhaps as games became more complex, but perhaps more importance was also put into making a good manual over time. Virtually all sequels had longer manuals than their predecessors, especially evident in RPG manuals which often had detailed walkthroughs in them.

The shortest manual at just two pages belonged to Rollerball, which was really more of a foldable pamphlet, followed by Predator at 6 pages.

The Miracle Piano Teaching System manual, meanwhile, is bound with those metal rings that I can’t find the name of and clocks in at 198 pages. You may notice in that link that it only shows 197 pages; since an odd number of pages is impossible if we are counting both sides of every page I assumed a page had been omitted.

The next three games in manual length are tied at 84 pages and are all RPGs: Ultima IV: Quest of the Avatar, Final Fantasy, and Dragon Warrior III.

Overall, the average was 23.84 pages per manual.

Colors

An example of a single color page

Almost all manuals had full color on the front/back and then a colored Nintendo Seal of Quality on the page opposite the front, but I’m not counting that as color. I’m sure black and white manuals were cheaper to print than full color, but I was surprised at the number of single color manuals. I suppose the cost is somewhere in between, but were some single colors cheaper than others?

There no full color manuals for the first two years of the NES’s life, yet almost all were by the end. I wonder if there was some kind of suggestion/mandate from Nintendo, if color printing became much cheaper in 10 years, or if companies just thought it was more and more worth it to make their manuals look nice.

Nintendo Seal of Quality

The Nintendo Seal of Quality was a way to assure consumers that they were buying a high quality product that wouldn’t damage their console.

Older circle emblem
Newer oval emblem


I assume Nintendo provided the image to be used in manuals, and at some point it changed from a circle to an oval. This probably happened in 1988, which makes the ovals from before that point likely to be reprints, although I’m surprised so many companies seemingly went to the trouble, and that there were enough in circulation for scanners to happen upon them.

Controller Diagrams

Something that I noticed when going through these manuals was how common yet varied controller diagrams were. In more modern game manuals it’s clear that a diagram has been provided, and possibly required, by the hardware manufacturer, but in these days it was seemingly up to each publisher. I’ll be sharing some of the oddest looking ones in my next post.

The real thing

The main difference I noticed was most diagrams had a controller with either 3 rectangles or 5 rectangles in the middle of the controller and pretty much never 4. There is still a lot of variation within the 3 and 5 rectangle labels I created, though publishers tended to stick to one diagram. The 3 rectangle style may have been to make the diagram less busy looking. Nintendo mostly used 3 rectangles with a few later exceptions.

3 Rectangles
5 Rectangles

Jumping and Attacking

Something that can immediately make a game feel bad is if the jump button is “wrong”. People strongly prefer jumping to be mapped to the A button, but perhaps this was less obvious to developers of the time.

Thankfully, A to jump makes up the majority of games and generally gained ground over time. Not all games have a jump or an attack, but attack has a smaller majority as the B button. The despicable Up to jump was recorded for 12 games.

I was surprised that I only recorded 11 games as having a run button set to A (1 game) or B (10 games). It’s something I associate strongly with platformers, but that may be the Mario influence.

Start and Select

It seems so universal that Start should pause and that Select should select something, yet this was not unanimous. Several games had A+B to pause, which I didn’t record, or referred to opening menus with the Start button, which I didn’t count as pausing.

Select is used less overall, which makes sense as it’s the least convenient button to reach.. Many manuals describe using the Select button to move a cursor on the title screen to the mode that the player wants to play. This seems like an overly cumbersome method when the control pad is available and allows for moving a cursor in two directions.

Notices and Advisories

As I was looking through these manuals I noticed a lot of boilerplate warnings or notices and wanted to document them. Some were a lot more common than others, some were pretty much always exactly the same, and some seemed to be written differently almost every time.

FCC Compliance

The FCC compliance notices were almost always in the back, but before the warranty information. Some boring legal boilerplate that you see on lots of electronics manuals. For some reason though they seemed to stop doing these late in the NES’s life. Looking at Super Mario World’s (A SNES game) manual now, and there’s no FCC notice and I can’t find any evidence that there was a separate sheet included with this information.

FCC Notice Example


Warranty Notice

The 90 day warranty notice was the last thing in many manuals, though it was right the front of many Konami manuals. Its rate of inclusion stayed steady throughout the NES’s life, and may have just been omitted by some scanners. I wasn’t able to scrounge up any information about this being a requirement for an officially licensed NES game, but I assume it is.

90 Day Warranty Example

Game Pak Precautions

Game Pak (as Nintendo insisted on calling their cartridges) precautions were almost always found near the beginning of manuals. This does not include separate warnings/instructions about inserting and removing game paks, although that is often included.

The wording and exact things being cautioned about varied considerably, more than any of the other notices I recorded. Nintendo must have given some guidelines, but let publishers do their own thing with these. The most common warnings were against opening the game pak, subjecting it to extreme heat or cold, touching the pins, cleaning it with thinners, solvents, benzene, or alcohol, playing for too long, sitting too close to the TV, and inserting or removing the game pak when the NES is on.

For whatever reason these warnings became much less common after 1992.

Game Pak Precautions Example

Epileptic Seizure Advisories

I didn’t realize when recording my data just how specific to a time period these warnings were. The pre-1990 warnings were probably later print runs of the manuals. If it was so important to warn about the risk of epileptic seizures, why did they become so rare later on? Were these perhaps moved to a separate slip of paper in the box? These warnings have been included with video game manuals for decades so it seems strange that they disappeared for a time.

Epileptic Seizure Advisory Example

Rear Projection TV Warning

Screen burn in was something I heard about a lot as a kid in the 90s, both with TVs and computers. I was constantly worried about it even though none of the TVs I used were projection based.

This is another odd case of a warning peaking in 1992 and then suddenly becoming less included, and in fact not a single 1994 manual has such a warning.

Rear Projection TV Warning

Memo Pages

Memo pages used to be fairly common in manuals. Used for recording passwords, high scores, or just notes to yourself.

I did not count blank pages, but any sort of invitation to write something down, even if it wasn’t a full page, counted.

The most memo pages was 9, in Metal Mech: Man & Machine. Over 28% of the manual was memo. The overall average was 0.51 memo pages per manual.

Game Advertisements

Sometimes publishers advertised their other games in a manual. This does not count non-game ads. It does count ads for games on other systems, which in this case only meant Game Boy and Super Nintendo.

The manuals with the most ads are Rampart and Shatterhand with 16. Both Jaleco games, which did a lot of this cross promotion with essentially a list of games on the back of the manual.

The overall average was 0.78 ads per manual.

Next up is a less statistical look at NES manuals.

Sources

DigitPress was the source of most of the manuals. A few were from ReplacementDocs too.

Wikipedia’s List of Nintendo Entertainment System games.

FLickr user bucky for some higher quality scans, including a color version of Faxanadu.


In part 1 I went over when games are released, and how that varies by the North American, European, and Japanese regions. What I’m covering in this post is the distribution of games between regions and how long it takes for a game to reach those regions.

Regions Over Time and By System

Almost every console and handheld game once saw a Japanese release, despite having a much smaller population than either North America or Europe, but now fewer and fewer games do. North America and Europe have both seen a consistent rise in the percent of games they receive. There’s a spike of multiregionalism in 2017 that we will see in many of these graphs.

This isn’t a breakdown of how well each system has sold in each region, but it’s pretty close. While Nintendo has seen more games released in North America and Europe than in Japan,  the difference is more extreme for Microsoft systems. The Saturn’s huge number of games released in Japan is the opposite of the Xbox. The PS2 to PS3 is a dramatic shift with around twice the percent of games coming to North America.

Regional Exclusivity

The number of games exclusive to Japan has been dropping pretty steadily for 25 years as fewer games are made there and more of them that do need international sales. The spike in 2020 is probably because many games that will see further releases later just hadn’t been yet at the time I gathered my data. There have never been many European exclusives but they have almost completely disappeared in the last 5 years. 2010 was an odd year with North American exclusives briefly overtaking Japanese exclusives.

We’re not likely to ever see another video game system so focused on one market than the Sega Saturn. The Wii U had a ton of digital games developed by one person or a very small team in America that weren’t able to even release their games in Europe. One region exclusives have largely gone out of style, the Switch, PS4, and Xbox One just having a handful in many regions.

Two Regions, but Not Necessarily Exclusively

I know this is an odd category, but it was easy to do. These are the percent of games released in two regions, and maybe the third. We can see that if a game was released in Japan it has always been almost equally likely to also be released in Europe or North America. But more games overall release in both North America and Europe.

I don’t have a lot to say about this one, all systems have kept roughly the same proportions of each combination, except the Saturn.

Two Regions Exclusively

Games released in North American and Europe but not Japan have risen over time as the Japanese market has shrunk. Although it’s just one more language, compared to the several of Europe, there are some unique challenges to localizing a game for Japan, which has made it less worth it for publishers. Meanwhile few games have ever excluded just North America or just Europe and that number has shrunk over time.

No system has bucked the trend of North America + Europe but not Japan being by far the most common combination of regions.

All Three Regions

It costs a lot of money to release a game in the three major regions, and generally only games with the widest possible appeal get the chance. This has increased over time as digital distribution has reduced some of that cost. Even rarer has been the simultaneous release, which requires a lot of coordination and perhaps sitting on a completed game for some time.

The earliest game I could find with a simultaneous release that I could verify (there’s some spotty and inconsistent information on some earlier DS titles) was Gran Turismo for the PSP on October 1st, 2009. It was even sold physically.

It’s clear here that simultaneous releases were unheard of until the 7th generation, but still rare. In the 8th generation they make up a fair portion of all games. Handhelds have been a bit behind their console counterparts on both three region releases and simultaneous releases.

Regions Charts

Sorry about the wording and coloring being a bit different, but here are the charts covering all of the data seen so far in this post. Not a single PS4 game exclusive to Europe and Japan, and not a single Xbox One game exclusive to North America and Japan.

Region Gaps

Sometimes there is a short amount of time between the release of a game in two regions, and sometimes there is a long amount of time. I am calling the number of days between a release in two regions the “gap”. Games released in only one region have no gap and are not figured into the calculations below, but games released in two regions on the same day have a gap of 0.

These gaps can be for several reasons: a game may not sell well in its initial region, a game has a lot of text, a game may have aspects that are difficult make understandable to a foreign audience, localization teams are busy with other projects, a game may have been made in a way that makes it technically difficult to add support for text that works in different ways and takes a different amount of space, or logistical issues.

The “relative gap” is handy because it also shows us which region gets games first, on average. The difference between positive and negative values is in which region gets a game first. If it takes an equally long amount for a game to reach either region it will stay at 0. This graph shows us that North America has gotten games before Europe on average for every Nintendo system, although it has taken a shorter and shorter amount of time. Games released in Japan used to overwhelmingly be released in Japan before heading to North America and Europe, but this has turned around with the Wii U and Switch.

The “absolute gap”, meanwhile, does not take the first region into account, it is just the total number of days between a release in two regions. Handhelds for some reason have taken longer to leave Japan than console games. Although the 3DS and Switch are handheld neighbors there is a large difference in localization times.

The Playstation has the largest average relative gap with Japanese games taking hundreds of days to reach Europe. Sony’s handheld games have also taken much longer to leave Japan compared to their console counterparts.

The Japanese-European difference only grows in the absolute graph, showing that games released in Europe before Japan take even longer to be localized. Sony’s console games have overall taken a bit longer than Nintendo’s to make the jump to second and third regions.

Despite its overwhelmingly Japan-only library the Saturn’s multi-region games are almost perfectly balanced between how long it takes to reach each region. The Xbox was an outlier for its time, with Japan having to wait on North American and European games instead of the other way around.

Interestingly, the Dreamcast is the only 6th generation console that took longer to release games in other regions than its 5th generation counterpart. The average number of days for a game to reach Japan has stayed very equal between North America and Europe on Microsoft systems.


Here’s the chart for the relative and absolute gaps. The Xbox One wins the award for smallest absolute gap with just 1.77 average days between North American and European releases, no doubt many of them on the same day. Meanwhile Europe to Japan or vice versa took almost a year on average for Playstation games.

I couldn’t resist finding what games took the longest amount of time to cross regional borders for each system. The PS1’s Dragon Ball Z: Ultimate Battle 22 also came up in my metascore study as being responsible for the worst quarter for any system, scoring a 32.03% and being very late in the system’s life. I was surprised that three Pokemon games appeared on this list, as Nintendo was really pushing it hard.

The game that, as far as I can tell, has taken the longest amount of time to be released between two regions is Breath of Fire III for the PSP. 3,820 days after the August 3rd, 2005 Japanese release (physical and digital), North America got a digital-only release on February 9th, 2016. That’s over a decade – the PSVita was about to celebrate its fourth birthday in North America at the time. Europe got a physical and digital release on February 3, 2006, which makes the North America-Europe gap the second longest regional gap.

Sources

Wikipedia’s lists of games by system – for release dates

MobyGames – for release dates


Release dates for games are something we take for granted now, but it didn’t use to be that way. Even big releases generally only had an estimate of what month you might be able to buy them. Super Mario Bros, one of the most important video games ever released, does not have a definitive North American release date

Sonic 2sday, November 24th, 1992, was a promotion by Sega for Sonic the Hedgehog 2 that led to games having set release dates like other media, and less like toys. This was an event to look forward to, rather than different outlets getting a game at different times and maybe not putting it out for sale for a few weeks. This wasn’t quite a worldwide release, with Japan getting Sonic 2 a few days earlier, but a near-simultaneous worldwide release was an impressive and unique feat for the time and was likely the reason games continued to be released predominately on Tuesdays for years to come.

This project looks at the evolving history of video game release dates, starting with the 5th generation – N64/PS1/Saturn/GBC. I didn’t include games from the 4th, Sonic the Hedgehog 2’s generation, because there were still so many games without an exact release date.

To qualify for inclusion games had to have been released in at least the North America, Europe, or Japan region and have at least one known exact release date. I only included consoles and handhelds from Nintendo, Sony, Sega, and Microsoft. The earliest games were Japan-only Sega Saturn games from 1994, and the latest games have announced dates later in 2020.

In total 31,338 games were included with 58,055 release dates.

Date information was mostly from Wikipedia’s lists of games, but several only had the first release date or no dates at all, so I had to manually look up and enter thousands of dates from MobyGames.  I ran many checks on the dates when I was done to find suspicious outliers and made many corrections, but I don’t claim my data to be perfect. My two sources, Wikipedia and MobyGames, also disagree on many release dates and I have no way to confirm which is true.

Sometimes games in Europe are released on slightly different days in different countries. When this was the case I used the United Kingdom’s release date. If there was no known United Kingdom release date I used the earliest known date.

Dates are shown in the mm/dd/yyyy format.

The distribution of Included Games

I’m including these first two graphs to give an idea of the sample sizes involved. 1994 and 1995 were early in the 5th generation and don’t have many games, so averages aren’t very reliable. Most of my data was gathered in early 2020 so there weren’t many games from that year either.

Some systems just didn’t have many games, like the N64, and some, like the GBA, had very spotty information so many games couldn’t be included.

Dates


Here is the average percent of games released in North America on every day of the year. The year on the next several graphs and charts are shown as 2000 because the tools I use won’t accept a date without a year, but it is the average from the full range of years used in the study. The dotted line at 0.27 (1/366*100) represents the frequency we would expect if every date saw an equal number of games released.

There are several outliers but there is a general trend of releases becoming rarer in late November and hitting rock bottom around the end and beginning of the year. Releases pick up slowly but steadily through February and March but then abruptly fall with the start of April. Things are slow but steady until the end of June which sees a surge of releases, before abruptly falling again as July starts. The end of March and June surge may have to do with financial quarters ending. Releases then grow quickly through the end of summer and throughout the fall as holiday shopping picks up, with the biggest release days in November.

Europe follows much of the same trends as North America. February and March see a few more releases, more spread out. There is another end of June surge. The fall flurry is a bit more spread out too, never reaching the same peaks, and ending a bit later.

Japan’s near total lack of releases in the early part of the year is more pronounced than North America’s or Europe’s. Very differently from the other two regions, Japan sees many releases in the last week of every month, but not quite at the very end of them. The middle of the year has fewer releases overall, but not by much.

(I suggest opening these in new tabs) First is the exact percent of games of every date, and second is every date sorted with the total number of games released on that date.

January 4th in Japan is the date with the smallest number of releases, at just one! The game in question was a DSi game known as Trajectile in North America and Reflect Missile in Europe and Japan. Unfortunately, I can’t say for sure it really came out on January 4th, wikipedia says it did, while Nintendo Life says it was the 20th. Regardless, January 4th may get so few releases in part because Japanese workers return from their New Year’s break on this date.

Speaking of Japan, holidays don’t have much of an impact on game releases. Golden Week is a series of 4 holidays on April 29th, May 3rd, May 4th, and ending with Children’s Day on May 5th. But April 29th is pretty average for an end of month date, and early May sees some of the fewest releases. August 15th stood out to me as an unusually light day, but some googling reminded me that this is the day Japan surrendered to the Allied powers, a somber day of mourning those who died in the war.

I was surprised that Halloween is the most common release date in North America, and only slightly less popular in Europe. It’s not a day I associate with buying video games. July 4th, the USA’s Independence Day, is among the least common, and Christmas Eve and Day also see few releases in either region.

North America and Europe have many holidays that can occur on different days of the year, making it difficult to determine if they have any impact.

Days of the Week

Sonic 2sday is sometimes credited as being the reason North American games continue to be released on Tuesdays as well as Tuesday just being the day books, albums, and DVDs come out, so of course video games do too. But is that really true? It wasn’t until 1998 that Tuesday became the most common release day, and it was a pretty small lead until 2003.

If you google when games are released in North America you’ll find plenty of articles and discussions about Tuesdays, but this actually stopped being true a few years ago. Thursdays have taken over and no one seems to have noticed.

Fridays have also seen a surge in releases, while Mondays and especially Sundays have become less popular. Wednesdays have stayed pretty stable.

Europe is pretty similar to North America in terms of dates of the year, but not in terms of days of the week. Friday long dominated releases until the early ’10s, when Tuesday, Wednesday, and Thursday all got a larger share. Saturday, Sunday, and Monday have always had few releases.

This article discusses several factors contributing to the history of Friday game releases in Europe, such as it being the traditional pay day, and to differentiate itself from other media that releases on other days of the week.

Japan, meanwhile, also has its own thing going on. Friday seems to be the big day for the mid 90s (remember that I had very few 1994 dates), but that changed very quickly in 1997 and 1998, instead becoming Thursday. Thursday continued to see most releases for many years, but lost ground in the 10s before reclaiming much of the ground it had lost. I don’t have a lot of 2020 releases for Japan, but it seems like it may have seen another sudden shift, back to Friday.

Tuesdays and Wednesdays have seen a smaller number of releases since 2008, while Saturday, Sunday, and Monday have had very few.

I can’t find any information about why games are released this way in Japan.

Here is a chart showing the exact values for the previous three charts. If we exclude 1994, 1995, and 2020, the lowest value is Sundays in 2018 in Japan, at 0.10%. The highest is Fridays in Japan in 1996 at 92.42% of releases, followed closely by Thursdays in Japan in 2005, at 91.77%.

Days of the Month

I have put the days of the month into 6 groups here because 31 nearly identically sized bars wouldn’t be very enlightening. We don’t hear about what days of the month games come out very often, so I was curious if there would be any interesting trends, and alas, they are almost equal, other than the first part of the month seeing a few less releases.

In the first part of the 25 Years of Games Project, I noted that almost all computer game release dates from the mid to late 90s seemed to be on the last day of the month. I was not sure if those games really did overwhelmingly release on those days, or if the exact date was unknown but every source I could find just said that they did without acknowledging the uncertainty. What I did not notice was a smaller, but still significant, portion of console games with listed dates on the last day of the month too. Looking through them it seems to be more common with N64 and PS1 games than Saturn. I still don’t know if this is a case of a legitimate industry trend, or poor record keeping of the time. 1995 would likely have shown the same bias towards the last day of the month if I had more data from that year.

Europe’s day of month releases look very similar to the North America’s, except that mysterious last day of the month trend is not there. In my findings fewer European releases have exact known dates, so I would expect there to be more uncertainty, more rough estimates, not fewer.

Japan’s major difference from North America and Europe is fewer releases in the beginning of the month, and more at the end, as we saw from the dates dot graph. The difference is still less extreme than day of the week differences, and has seen much less change over time.

Here is every single ungrouped day of the month, with all years combined. The 25th, 26th, 27th, and 28th stand out among Japanese releases. North America and Europe stay pretty similar to each other, with a few exceptions like the 1st, 7th, 18th, 29th, and 31st.

I provide these huge tables so you can find patterns yourself if you really want, and to “show my work” and be transparent about my data.

Months

The distribution of months hasn’t changed much in North America over time. The holiday shopping season of October and November has gotten fewer releases over time. 2019 stands out, with May having more releases than October or November after being one of the slowest months for many years.

Europe is not too different from North America in terms of months of releases. 1999 was quite an odd year with over half of all games releasing in October or later.

Japanese releases are more spread out through the year, with a small bump at the end of the year. January and May have few releases in all regions.

Here is the overall month distribution of each region. I didn’t mark it but 8.33% is where the these bars would be if every month had an equal number of games. I’m not sure why March is so popular. It may get some games that were intended for September-November but got delayed, or maybe there is just a need to get games out before the slow spring and summer season. Japan has quite a large drop from December to January.

This is all of the month data. January 2000 in Europe was the slowest month in the years included in the study, just 1% of the games that year. On the other side of the spectrum, in North America one fourth of the releases in 1998 were during October.

That is all of the detailed date data I have for you. With this data set I was also able to learn a lot about how many games are released in different combinations of regions, and how long it takes for games to release outside of their home region, so please come back next month for part 2.


Sources

Wikipedia’s lists of games by system – for release dates

MobyGames – for release dates

Sonic the Hedgehog 2 – information about Sonic 2sday

Happy Sonic 2sday (almost) – more information about Sonic 2sday

Al Nilsen – former Sega employee for the Sonic 2sday sticker image


More content

The first part of this project has some important context about how this study was conducted.

I realized I had a lot of data I could find that wouldn’t really make for a good graph, and some trivia that didn’t fit anywhere. This is a more loosely structured post, so please forgive the abrupt changes of subject.

More on Metascores

The day with the most games released with a 90+ metascore was, well, a two way tie.

  • February 29th, 2000
    • Dead Or Alive 2 (Dreamcast)
    • Tony Hawk’s Pro Skater (N64)
    • Rayman 2: The Great Escape (Dreamcast)
    • Resident Evil: Code Veronica (Dreamcast)
  • November 18th, 2001
    • Star Wars Rogue Squadron II: Rogue Leader (Gamecube)
    • Madden NFL 2002 (Gamecube)
    • IL2-Sturmovik (PC)
    • Tony Hawk’s Pro Skater 3 (Gamecube)

Great days for Dreamcast and Gamecube. Wow, Dreamcast had 7 games release on Leap Day, and Chu Chu Rocket was pretty close to the 90+ club.

The greatest drought between games with a 90+ metascore was… ok, I was going to say between Realms of the Haunting and Dungeon Keeper, but in double checking I have now found 3 possible release dates for Realms and the one I have recorded is probably wrong.

Let’s instead go with Out of the Park Baseball (3/23/06) and Company of Heroes (9/13/06), a period of 174 days. Remember how 2006 saw that dip in metascores?

Two games, one name, two developers, one score.

More on Descriptors

Are you ready for more content descriptor details? The game with the most descriptors I could find was 9, and it’s not something you would expect:

I didn’t get into this before, but the ESRB combines substance descriptors if they’re both “use” or both “reference” for some reason. Not sure any game has all three. That was a bit of a pain to deal with.

Anyway, I have no idea why this singing game has so many, and oddly enough the Switch version only has 8, no Partial Nudity.

Several other games had 8 descriptors, most are current generation:

  • Constructor Plus (Switch, 3DS, PS4)
    • Blood, Crude Humor, Drug Reference, Language, Suggestive Themes, Use of Alcohol, Use of Tobacco, Violence
  • Constructor HD (Xbox One, PS4)
    • Blood, Crude Humor, Drug Reference, Language, Suggestive Themes, Use of Alcohol, Use of Tobacco, Violence
  • Night in the Woods (Switch, PS4, Xbox One, PC)
    • Fantasy Violence, Mild Blood, Sexual Themes, Drug Reference, Language, Crude Humor, Use of Alcohol, Use of Tobacco
  • The Red Strings Club (Switch)
    • Blood, Drug Reference, Nudity, Strong Language, Suggestive Themes, Use of Alcohol, Use of Tobacco, Violence
  • Thimbleweed Park (Switch, PS4, Xbox One, PC)
    • Crude Humor, Drug Reference, Language, MildBlooo, MildVio, Sexual Themes, Use of Alcohol, Use of Tobacco
  • Def Jam Rapstar (Wii, PS3, Xbox 360)
    • Drug Reference, Mild Blood, Mild Violence, Partial Nudity, Sexual Themes, Strong Lyrics, Use of Alcohol, Use of Tobacco
  • Grand Theft Auto V (PS3, PS4, Xbox 360, Xbox One, PC)
    • Blood and Gore, Intense Violence, Mature Humor, Nudity, Strong Language, Strong Sexual Content, Use of Drugs, Use of Alcohol
  • Duke Nukem Forever (PS3, Xbox 360, PC)
    • Blood and Gore, Intense Violence, Mature Humor, Nudity, Strong Language, Strong Sexual Content, Use of Drugs, Use of Alcohol
  • Skylight Freerange (Vita)
    • Violence, Blood, Sexual Themes, Nudity, Drug Reference, Strong Language, Use of Alcohol, Use of Tobacco
  • Skylight Freerange 2 (Vita)
    • Violence, Blood, Sexual Themes, Nudity, Drug Reference, Strong Language, Use of Alcohol, Use of Tobacco

The only game with both Mild Fantasy Violence and Mild Cartoon Violence was Xbox Live Arcade Unplugged Vol. 1. Okay, a compilation, but it doesn’t seem like there should be a reason those don’t ever appear together otherwise.

The only game with Nudity and Simulating Gambling was Dead or Alive Xtreme Beach Volleyball.

I had to check the box to make sure it wasn’t an error on the ESRB website. But yes, Loons has two degrees of violence. I don’t think any other game I looked at had two “tiers” of something. I have to imagine it was a mistake.

Is there any actual content differences between these versions? I believe the Vita version was released before the “rate it yourself for cheaper” program.

I’m again not familiar with these two games, but could the Cartoon Violence really be significantly more major in one version? Usually when a game is released on multiple platforms, even months apart, it gets one entry if they have the same content. Maybe for some reason different people handled these two and had different opinions?

Fantasy Violence wasn’t a descriptor when the original was released, so fair enough there, but that is quite a difference in descriptors.


More on the ESRB Website and ESRB Weirdness

This game was known as Speedster in Europe, and Rush Hour in North America. Why does a North American rating system website have the European title at all? This was the only two name case like this I came across.

Released on “Nintendo”, I came across a few of those.

I was pretty confused by this when I saw it, but I found an article where the creator discusses what and why he tones down the Wii U version.

Should a crossword game where the clues are a bit off-color (this actually sounds extreme for a newspaper puzzle) count as much as if there were actual characters engaging in these acts? It’s a bit of an edge case. It’s also funny that they censored “ass” on this website aimed at adult parents.

The ESRB’s website will ignore spaces when searching titles. Finding the rating of a Playstation game called “One” was quite an experience. It was on something like the 37th page (results are chronological) and you can only go forward one page at a time. You can filter by system, but only for some newer systems because why would would anyone care about something old.

If you were wondering why I didn’t just look at a picture of One’s case on eBay, I did. Games are supposed to list their descriptors on the back, below the ESRB rating, but this one didn’t.

This My Little Pony game doesn’t have any ESRB information at all on the back. I can’t find much information about game box art requirements, like what size things have to be, where they need to be placed, just “in June 2003 — the ESRB announced new labeling procedures (requiring the prominent display of back-of-the-box information)“, which is odd since the overwhelming majority of games already had that. I suppose publishers handle box art, but there is still enough structure to them that they must have a lot of requirements.

After a bit of browsing, I found this E.T. game for Game Boy Advance without any ESRB information on the back.

The Best, worst and Most Average game

I realized that with all of the data I have that I can construct what would theoretically be the best and worst game possible, based on averages. This is a for fun exercise, please don’t take it too seriously.

The worst possible game, based on average metascores:

  • System: Wii
  • Release Date: August 4th, 2007
  • Genre: Educational
  • ESRB Rating: Everyone (Early Childhood games don’t even get ratings so I won’t assume)
  • ESRB Content Descriptors: None
  • Length: As short as possible, definitely less than 4.5 hours to beat

The best possible game, based on average metascores:

  • System: Xbox One
  • Release Date: December 28, 2019
  • Genre: Role-Playing and Compilation
  • ESRB Rating: Mature
  • ESRB Content Descriptors: Sexual Content, Nudity, Use of Tobacco, Use of Alcohol, Use of Drugs, Intense Violence, Blood and Gore
  • Length: As long as possible, at least 15 hours to beat

That best possible game sounds a bit like a Mass Effect trilogy compilation, which has been rumored as of this writing (May 9th).

Most average game, based on average metascores:

  • System: Game Boy Color
  • Release Date: February 3, 2010
  • Genre: Simulation
  • ESRB Rating: E10+
  • ESRB Content Descriptors: Crude Humor
  • Length: 7.5 hours to beat

Ignoring system, but considering proximity to the actual average score of 70.25, we might label The Urbz: Sims in the City to be the most average game of the past 25 years. It doesn’t quite fit every parameter, but nothing will. I’m sure there’s better ways of finding “most average” than looking at what parameters line up in the middle of metascores, too.

That’s all for the 25 year project. Is there a specific thing that I could find quickly with the information I have that you’re curious about?

Sources

GameRankings.com for metascores and some release dates. Archives: 1, 2, 3

MobyGames.com for genres, some release dates, some ESRB ratings, and some ESRB content descriptors

HowLongToBeat.com for main story and completionist times.

ESRB.org for ESRB ratings and ESRB content descriptors

Wikipedia for its many lists of games

Content Descriptors Background

The first part of this project has some important context about how this study was conducted.

The ESRB does not just give games ratings, it also uses content descriptors to more specifically describe content that consumers may find objectionable. Very similar, appearing in the same place as content descriptors on the back of game boxes, are also “Interactive Elements” that describe online features that consumers may want to know about before buying a game, such as In-Game Purchases or Shares Location. I did not include interactive elements in this study.

I find these content descriptors so interesting for two reasons. One, because it’s a look at how an organization tries to organize and sort thousands of games based largely on what parents might not want their children to be exposed to, and two, because it’s a formal description of what kind things happen inside a game. No one else is going to make a list of games that have “Cartoon Violence, but it’s pretty mild” but a ratings agency.

By my count there have been 49 content descriptors used during the life of the ESRB. Several have been retired. A couple seem to be “retired” in that they have been replaced with other descriptors but have been used a few times since their retirement, perhaps in error. Two, as far as I can tell, have never been used.

Some Adult Assistance May Be Needed shows up on many lists of content descriptors, including Wikipedia’s, but does not appear on the ESRB’s list of descriptors, though presumably it did at some point. These lists say that it is exclusive to Early Childhood games. MobyGames claims a single game has received this descriptor, Disney’s Little Einsteins. This game is rated Everyone, not Early Childhood. The ESRB’s page for the game says it has no descriptors. GameFAQ’s scans of the box also show no descriptors.

Real Gambling, used for games where real money is exchanged while gambling, is listed on the ESRB’s list of descriptors, but I can find no evidence it has ever been used. You may be aware that Peak Entertainment Casinos is the only game to receive an Adults Only rating for having real gambling, and that is true. However, it has the content descriptor “Gambling”, a descriptor that was retired, seemingly split into Simulated Gambling and Real Gambling. The Gambling descriptor was also used for Dead or Alive Xtreme Beach Volleyball, which only features gambling for in-game currency.

There are many descriptors with “mild” prefixes, but the ESRB does not acknowledge these as separate descriptors from the non-prefixed versions (except for the substance ones, which are worded differently), on their website, but do list the “strong” prefixed versions.

The ESRB categorizes content descriptors, but I did not realize this before I had already categorized them myself. The only difference ended up being that I put blood and violence in the same category, and I included retired descriptors.

ESRB Content Descriptors – Distribution

I’m starting with this mammoth chart so I can list all of the descriptors and their approximate dates of use. You’ll notice some descriptors used once or twice and then not used for years before being used regularly, like Tobacco Reference appearing in one game, 4 years before any other substance reference descriptor appeared.

I looked it up and that game was Commandos: Beyond the Call of Duty (an expansion pack, but a standalone one, so it counts). If you go to ESRB.org (where I got most of my ESRB information) and search for that game, you’ll see this:

But if you go to Steam, where it is currently for sale, you’ll see this:

So, which is correct? The Steam listing has “Animated Violence”, one of those “retired but not” descriptors, which makes it look much older than the ESRB one. It’s possible Steam used the game’s old, original ESRB rating for some reason (the back of the box seems to confirm this was the original rating), and then the game got re-rated by the ESRB some time later. Why would the game get re-rated if if not for the Steam release, though?

I spent at least 20 minutes putting together the evidence for this one specific game and I still don’t know what should “count”. The ESRB website has a lot of odd conflicting information and I didn’t have the will to double check and investigate every single one.

Furthering my point that it’s very hard to determine the history of descriptors let’s look at MobyGame’s list of games with Animated Violence. One game in 2018, one in 2011, a handful until 2003, and then dozens every year before that. The ESRB’s content descriptor list in February 2004 doesn’t mention it, but a list from February 2001 has it under “discontinued content descriptors”. And yet that MobyGames list has dozens of uses of the descriptor in 2001 and 2002! And looking at that ESRB page from 2001 page I am seeing for the first time the descriptor “Reading Skills, Fine Motor Skills, Higher-Level Thinking Skills”. Searching for that exact phrase in Google right now returns 25 results, all pretty much verbatim copies of that outdated list, no games mentioned as using it, so I guess that’s three never used descriptors. No one has found it interesting enough to discuss until now, either. I have really been down a rabbit hole on this subject.

So, as I discuss when these descriptors began and ended I will be ignoring some outliers. If nothing is stated, then the descriptor has been in continuous use since the start of this study, in 1995.

  • Substances
    • Alcohol Reference – Started in 2003 with the other [Substance] Reference descriptors
    • Use of Alcohol
    • Drug Reference – Started in 2003 with the other [Substance] Reference descriptors
    • Use of Drugs – Started in 2002, it seems odd it took longer than Alcohol and Tobacco.
    • Tobacco Reference – Started in 2003 with the other [Substance] Reference descriptors
    • Use of Tobacco
  • Violence
    • Animated Blood – Animated in these descriptors means “cartoony”, not that it is moving.
    • Animated Blood and Gore – Probably meant to be retired in 2002, but has popped up once in a while since then.
    • Mild Animated Violence – Probably meant to be retired in 2002, but has popped up once in a while since then.
    • Animated Violence – Probably meant to be retired in 2002, but has popped up once in a while since then.
    • Mild Blood – Probably started in 2006, that was the first year I have with more than one use.
    • Blood – Started in 1997, or I just got very unlucky with my small number of games from 1995 and 1996.
    • Realistic Blood – Stopped being seen after 2000, the other “Realistic” descriptors were last seen in 2001.
    • Blood and Gore
    • Realistic Blood and Gore – This may have been intended as a stronger version of Blood and Gore because they coexisted, but last seen in 2001.
    • Mild Cartoon Violence – Started 2003.
    • Cartoon Violence – Started 2003. One of “4” (they didn’t include mild versions as separate, so it should be 6) new descriptors announced in June 2003.
    • Mild Fantasy Violence – Started 2003.
    • Fantasy Violence – One of the “4” new descriptors announced in June 2003. I have several from before then, somehow.
    • Intense Violence – One of the “4” new descriptors announced in June 2003.
    • Mild Realistic Violence – Discontinued in 1996 or 1999.
    • Realistic Violence – Gone after 2001.
    • Mild Violence
    • Violence
    • Violent References – Began in 2007.
  • Humor and Mischief
    • Comic Mischief
    • Crude Humor – Probably started use in 2003, although never got a press release like the “4” did.
    • Mature Humor – Probably started use in 2003. Likely a “Strong” version of Crude Humor as we’ll see later.
  • Educational
    • Edutainment – Last seen in 2008.
    • Informational – Last seen 2001.
  • Gambling
    • Simulated Gambling – Started in 2004.
    • Gambling – In use 2000-2004, probably split into Simulated Gambling and the never seen Real Gambling.
    • Gaming – Last seen 2000. Seems to have been replaced with the short lived Gambling. This word is occasionally used as a way to say “gambling” but feels a bit old fashioned, perhaps due to the rise of video and computer games.
  • Language
    • Mild Language
    • Language – Either started in 1998, or I got unlucky with my sample. MobyGame’s list makes it look like it may have indeed started then. It would be odd if it was introduced after its Mild and Strong versions.
    • Strong Language
    • Mild Lyrics – Introduced in 2001.
    • Lyrics – Seemingly introduced in 2004, also after its Mild and Strong versions.
    • Strong Lyrics – Introduced in 2001.
  • Sexual Content
    • Partial Nudity – First used 2001, maybe 2002.
    • Nudity – First used 2002.
    • Sexual Content – First used 2008, or maybe 2006.
    • Strong Sexual Content – Probably around for 25+ years. Oddly, I have no 2019 games with this after a 17 year run.
    • Mild Sexual Themes – Introduced 2008, significantly after its non-prefixed version.
    • Sexual Themes – I’m inclined to think this started in 2004, if not then it’s an odd case of a descriptor suddenly rocketing up in use.
    • Mature Sexual Themes – Last used 2004. It’s possible this was replaced with Sexual Themes, which seems like maybe a way to downplay it.
    • Sexual Violence – This is so rare it’s hard to say. Only seen in 2014. In fact, it was only seen in one game in this study, which was ported to 4 systems: Metal Gear Solid V: Ground Zeroes.
    • Mild Suggestive Themes – Began use in 2004.
    • Suggestive Themes

Alright, now I can get to the graphs I usually start with. Please note the Y-axis of these graphs, some categories of descriptors are much more common than others. Alcohol is the most common substance overall and drugs the least. There seems to be more and more smoking in video games over time, quite the opposite of the movie industry.

It’s odd how Animated Violence was semi-retired just as Violence took off (but it did already exist). They are distinct things so it wasn’t a replacement.

A sharp decline in Comic Mischief after a huge spike. I have to wonder how the raters are trained on this kind of thing, do they just read a list of descriptors? Has the public perception of what is Comic Mischief changed over time, or have game developers decided to employ it less than a tenth as often as they did a decade ago?

Two very rarely used descriptors that haven’t been seen in a long time. Informational is an odd one, it was for games with reference material, data, that kind of thing. The only games I have using it were Need for Speed: Porsche Unleashed, Virtual Kasparaov, Timeline, and Timescape: Journey to Pompeii.

It took a few tries, but the ESRB eventually decided what term to use. Gambling is pretty low overall, perhaps PEGI (the European equivalent of the ESRB) standards for games with gambling influenced developers worldwide.

It took a while before technology allowed the playing of music with potentially objectionable lyrics, but it’s never been very common. I wonder if the shift towards real voice clips over text influenced the rise of bad language.

Many of these descriptors sound similar. Aren’t they all “Sexual Content”, why is that a separate descriptor? This article is a good overview of how all of these differ. Mild Suggestive Themes was sure big for a while, but then drastically fell in use.

I see now that the long bar graph is missing Alcohol Reference, sorry about that. Violence is by far the most common descriptor used, with Blood at #2 with just over half as many uses . Four ports of Metal Gear Solid V: Ground Zeroes makes Sexual Violence the second rarest descriptor. But the rarest, Mild Realistic Violence, was only seen in Noir: A Shadowy Thriller and Professional Bull Rider.

Overall, all kinds of violence dominate games.


Here is how common every combination of descriptors is. The white cells are the overall percent of games that have that descriptor, and then the pink cells at the bottom are what percent of games have that descriptor as their sole descriptor.

It’s safe to say that games have added more and more things to warn about over time, but the ESRB has also expanded what kinds of things they have descriptors for over time. Referring to substance use wasn’t deemed worthy of note until 2003, for instance. I’m sure a number of games released before then would have qualified.

This graph fits pretty well with the general trends of more descriptors over time, and how descriptors relate to ESRB ratings, which we’ll look at later.

ESRB Content Descriptors + Metascores

The better a game is, the more content descriptors it has on average, with quite a jump in the highest tier. Do you think people are more satisfied the more realistic the violence, the more graphic the sexual content?

Games with Sexual Content are more liked than games with any other descriptor. Yet Strong Sexual Content doesn’t do quite as well. Sex in general is a pretty strong indicator of quality, remember that the overall metascore average is 70.25, every sex descriptor is above that. The three substance use descriptors are very close in scores and above average, but merely referring to those same substances scores several fewer metascore points.

Simulated Gambling, perhaps an in-game casino, really seems to turn off reviewers. Cartoon Violence may be so low due to being common in cheap licensed games or just kiddie fare in general. Referring to violence is evidently less satisfying than seeing it.

ESRB Content Descriptors + Genres

In some genres a substance will be alluded to more often than used, and in other genres it’s the other way around. Makes sense for the narrative genres to have more substance descriptors in general.

Role-Playing heavily favors Fantasy Violence due to usually being have some kind of magical or supernatural combat. Compilations have the most Cartoon Violence for some reason.

Again, please note the Y-axis on these graphs will change. Action really favors Crude Humor over Comic Mischief. Not a single Educational, Puzzle, or Simulation game had Mature Humor.

No surprise that Educational games have educational descriptors.

It’s odd that a genre as general as Action is so low in gambling compared to others. I don’t associate Compilations with gambling, I have no idea why that is so high.

The lyrics descriptors more or less work as an indication of how much English language licensed music appears in games, very rarely in Role-Playing, but fairly often in Sports. Simulation includes the likes of Rock Band, so that’s why it has such a showing for lyrical content.

I’m baffled as to why Racing / Driving has the highest rates of Nudity. Role-Playing games overall rank pretty high when it comes to sexual descriptors, while Educational, Puzzle, and Sports games are decidedly unsexy.

Role-Playing attracts a lot of potential content descriptors, Compilation’s high number makes sense, every game can add a few more.

All that Genre + Descriptor data in a chart.

ESRB Content Descriptors + Game Lengths

The longer a game is the more descriptors it has on average.

ESRB Content Descriptors + ESRb Ratings


The two (of 22) Early Childhood games with descriptors had Edutainment descriptors. There were only two Adults Only games included, but there’s also only a few dozen ever published. Steady increases in descriptors as rating become more severe.

Games rated Everyone rarely have any sexual or substance descriptors, and the violence tends to be fantasy or cartoon based. About 11 descriptors appear in more than 2% of E rated games.

Fantasy Violence suddenly becomes much more prevalent with E10+ games. More descriptors in general, 20 over 2%.

Violence now rockets up in use. Only slightly more descriptors used above 2% of the time, 21.

Blood and Gore and Strong Language now become much more prevalent. Only 18 descriptors used over 2% of the time. Teen games seem to employ the largest variety of descriptors, although it’s pretty close and 2% was an arbitrary cut off.

And here is how common every descriptor is with every rating. I wonder if the ESRB has hard rules for which descriptors can be used with which ratings. It would make sense for a game with Use of Drugs to not be allowed less than a Teen rating, but is there a rule against Mild Fantasy Violence in a Mature rated game, or has there just not been any (any in this study, at least) games that have done that?

And that’s all my graphs and charts for content descriptors. There will be one more bonus post before the next project. It will have some trivia and odd things I found in the course of making all this.

Sources

GameRankings.com for metascores and some release dates. Archives: 1, 2, 3

MobyGames.com for genres, some release dates, some ESRB ratings, and some ESRB content descriptors

HowLongToBeat.com for main story and completionist times.

ESRB.org for ESRB ratings and ESRB content descriptors

Wikipedia for its many lists of games

System Infographics

The first part of this project has some important context about how this study was conducted.

As a bonus today I have system infographics summarizing some of the information I’ve gone over so far. It’s nice to directly compare systems on a variety of statistics.

There is some important information about how these numbers were obtained in the other parts of this project, please see Part 1 if you haven’t already.

Nintendo Systems

Sony Systems

Sega Systems

Microsoft Systems

Personal Computer

Sources

GameRankings.com for metascores and some release dates. Archives: 1, 2, 3

MobyGames.com for genres, some release dates, some ESRB ratings, and some ESRB content descriptors

HowLongToBeat.com for main story and completionist times.

ESRB.org for ESRB ratings and ESRB content descriptors

Wikipedia for its many lists of games