ESRB Ratings Background

The first part of this project has some important context about how this study was conducted.

The Entertainment Software Rating Board gives content ratings to games and is recognized in the United States, Canada, and Mexico. The first games to receive ratings were released midway into the 4th generation in September 1994 and included Pitfall: The Mayan Adventure, Sonic Triple Trouble, Super Punch Out!!, Donkey Kong Country, and Doom (32X). The data we’re looking at starts at the fifth generation, so most of the ESRB’s history is included.

The following summaries of the ESRB ratings are based on the ESRB’s descriptions of them, the content descriptors post will go into more detail:

Early Childhood was aimed at young children and was mostly educational games. This rating was retired in 2018 with no announcement until the ESRB replied to a tweet asking about it in 2019. I find it interesting and odd that there being few eC games would be a reason to ditch a useful label. These games had no objectionable content and can only have a small number of content descriptors, I found one used on two games in this study.

The ESRB removed any mention of this rating from their rating description page. In fact, they removed the image of the rating from their website completely:

I took that screen capture several months ago and I was double checking a few things while writing this and it now seems to be impossible to find Early Childhood games by searching the ESRB website:

But they can still be found with a google search, although there’s just a blank space now instead of a broken image:

Everyone was known as “Kids to Adults” until 1998. These games can have only mildly objectionable content such as mild language or violence. Some games rated Everyone have content descriptors, some do not.

Everyone 10+ was introduced in March 2005 as a rating for games in between Everyone and Teen and suitable for players at least 10 years old. All E10+ games have at least one content descriptor.

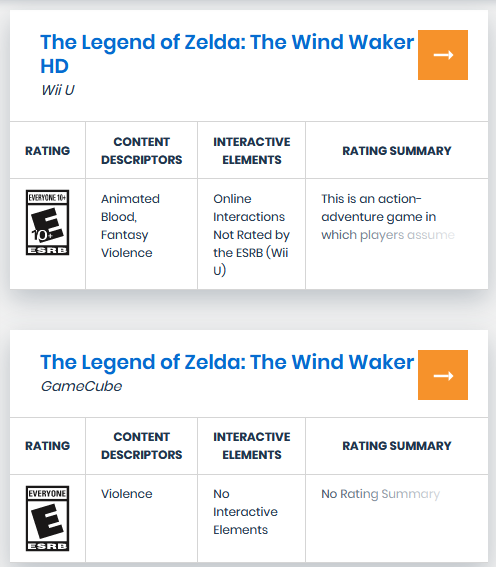
Some games that got re-rated later were changed from E or T to E10+:

Teen rated games are intended for audiences at least 13 years old. Games with this rating may include simulated gambling or some blood. All Teen games have at least one content descriptor.

Mature rated games are intended for ages 17 and up. They can include intense and realistic violence, language, and sexual content and they all have at least one content descriptor.

Adults Only rated games are for those 18 and up. Games with this rating can have extreme violence, graphic sexual content, and gambling with real money (Peak Entertainment Casinos is the only game to have received this rating for gambling). The big four console manufacturers never allowed games with this rating to be released on their platform, and few retail stores will sell PC games with it, making it quite rare. Wikipedia has a nice list of these games.

ESRB Ratings Distribution

To start with here is the overall distribution of ESRB ratings. The extreme ends of the scale are quite small, but roughly 1 in 1,000 games are eC, and roughly 1 in 10,000 are Ao. Eight of the 22 eC games in this study were Sesame Street games, the two Ao games were Hatred and Seduce Me.

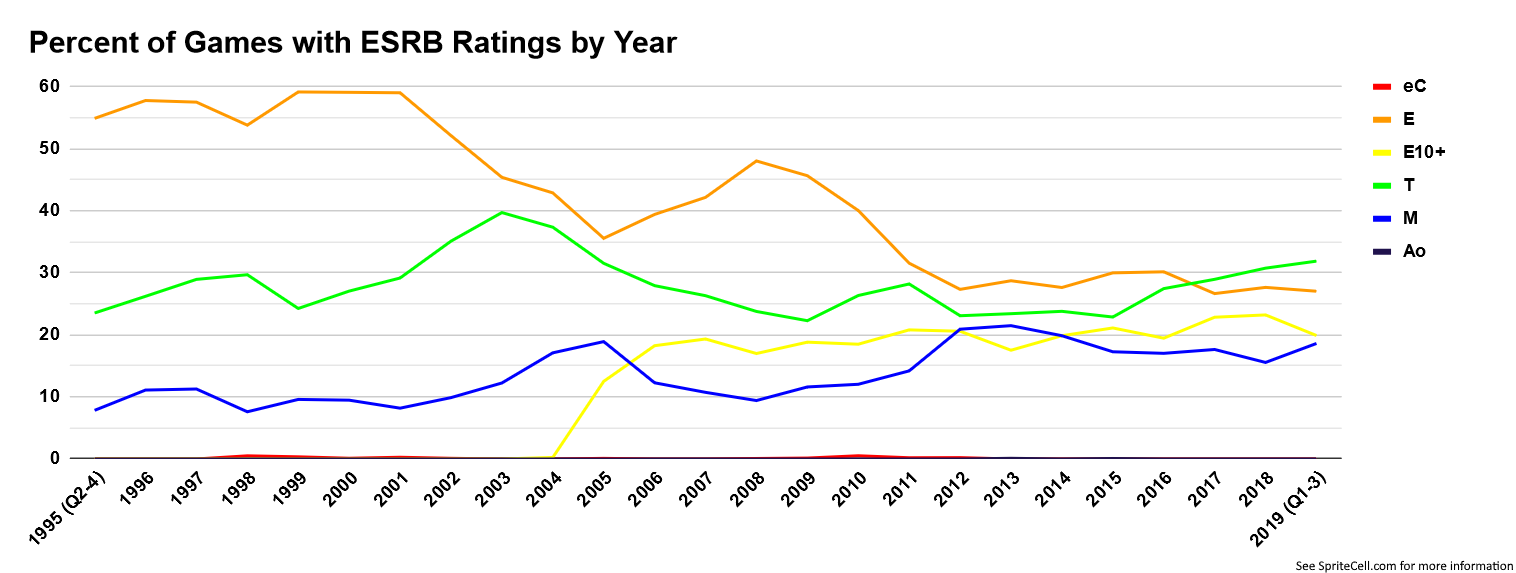
Games rated Everyone have only recently been overtaken by Teen games and the overall distribution of the ratings have become closer. What was it about 2001 and 2008 that kicked off a trend of games becoming less for Everyone?

This 6 year old article claims that E ratings represent 70% of all games. It seems like the source is the ESRB itself, which would probably want to paint games in a child-friendly light, but that number seems incredibly high to me. Sure, the kinds of games not included in this study might trend towards inoffensive, and there are mobile and other platforms not included here, but that still seems very high.

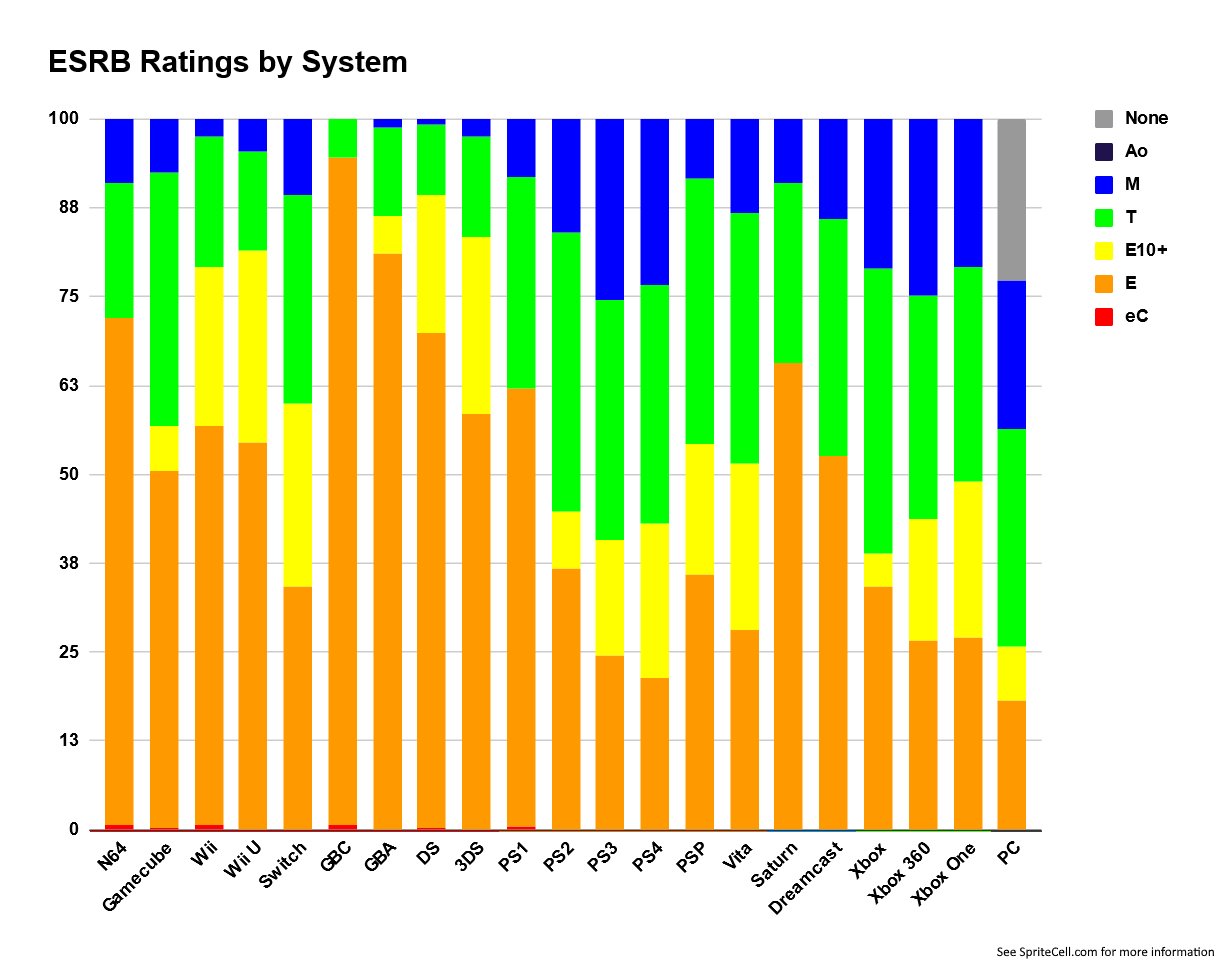
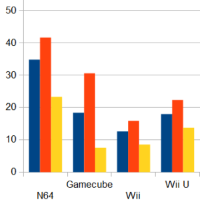
The N64 and Wii have the largest number of Early Childhood games, and Nintendo systems in general have more games on the child-friendly side.

The Game Boy Color has the highest percent of Everyone rated games, and at 93% this is the largest share of a rating for a system. If you don’t count the PC (and you shouldn’t, the unrated games take a chunk out of everything) the PS4 has the smallest percent.

The Wii U has the largest share of E10+ games, while the PS3 has the smallest, if you discount the systems that were out when the rating started to be used.

Meanwhile the Xbox is the most Teenage system, while the Game Boy Color is the least.

Most Mature goes to PS3, and there were zero Game Boy Color games rated Mature, and not just of games included in this study.

All two Adults Only titles included were for the PC.

Handhelds definitely get fewer games with objectionable content. For a while it certainly helped that they were less capable of rendering anything realistic, but even past that developers just don’t put those kinds of games there.

ESRB Ratings + Metascores

But what ratings do people prefer for their games? None of the Early Childhood games had metascores, and the very small sample size of two Adults Only games averaged 43.16.

Everyone, Everyone 10+, and Teen rated games are quite close, and their average, mean, and mode paint slightly different pictures. There is a small bump in metascores for Mature rated games. This may partly be because few cheaply made games are rated Mature and there is almost certainly a correlation between budget and metascore.

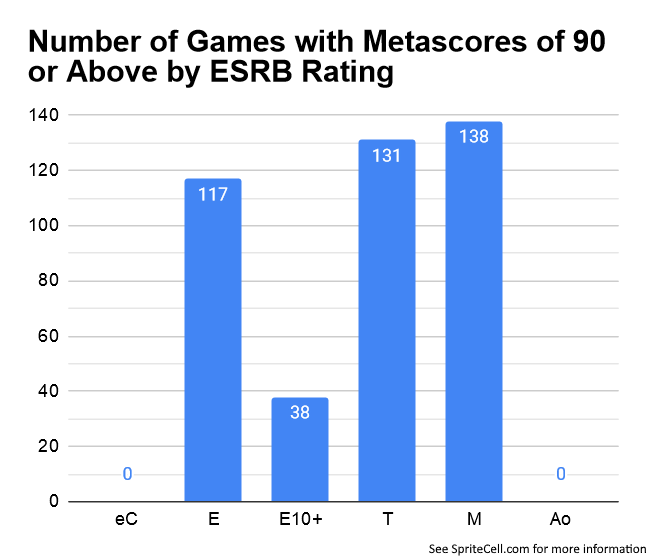
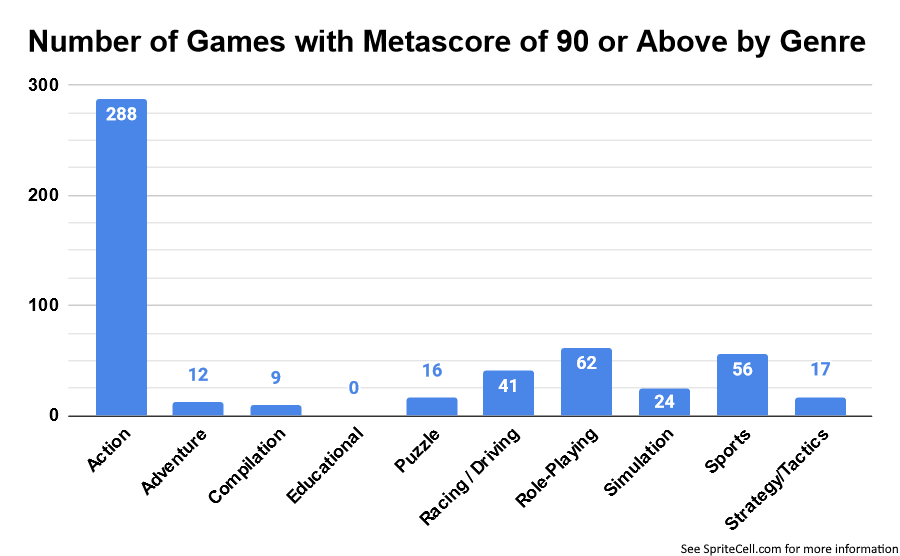
Mature rated games come out on top, both in overall 90+ metascores and in the percentage of games scoring that high.

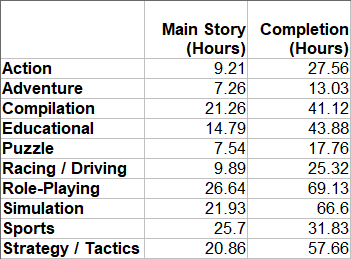
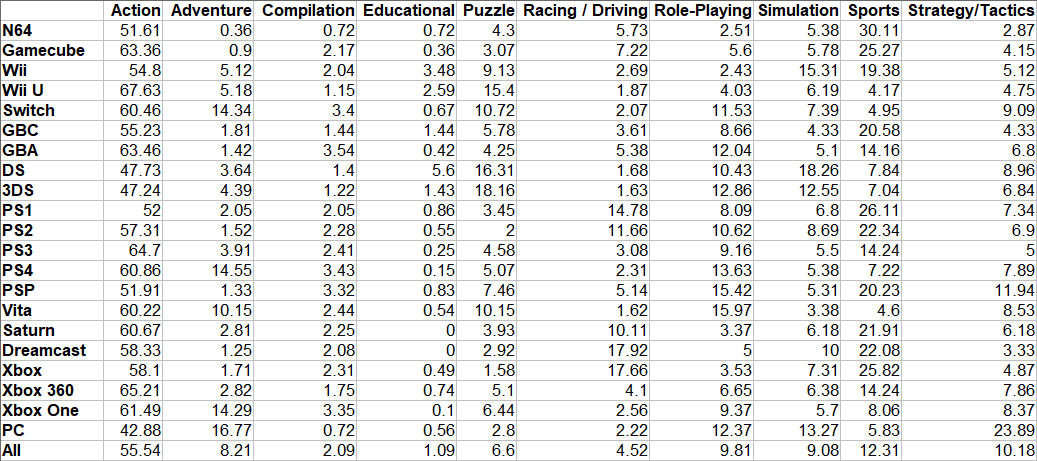
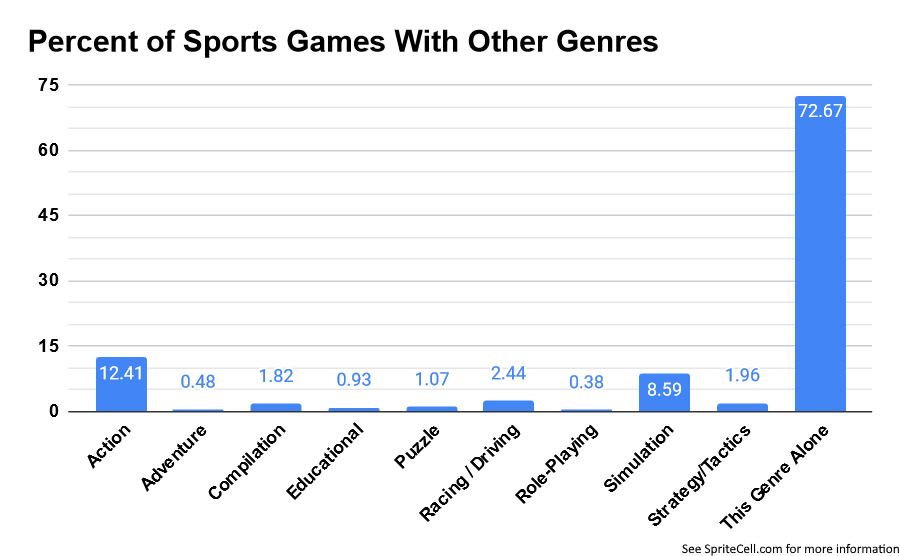
ESRB Ratings + Genres

Adventure and Role-Playing, the narrative-driven genres, have the highest ratings overall. Is it harder to tell a compelling story without graphic violence, sexual situations, and bad language?

Educational, Puzzle, and Sports are all understandably low in objectionable content.

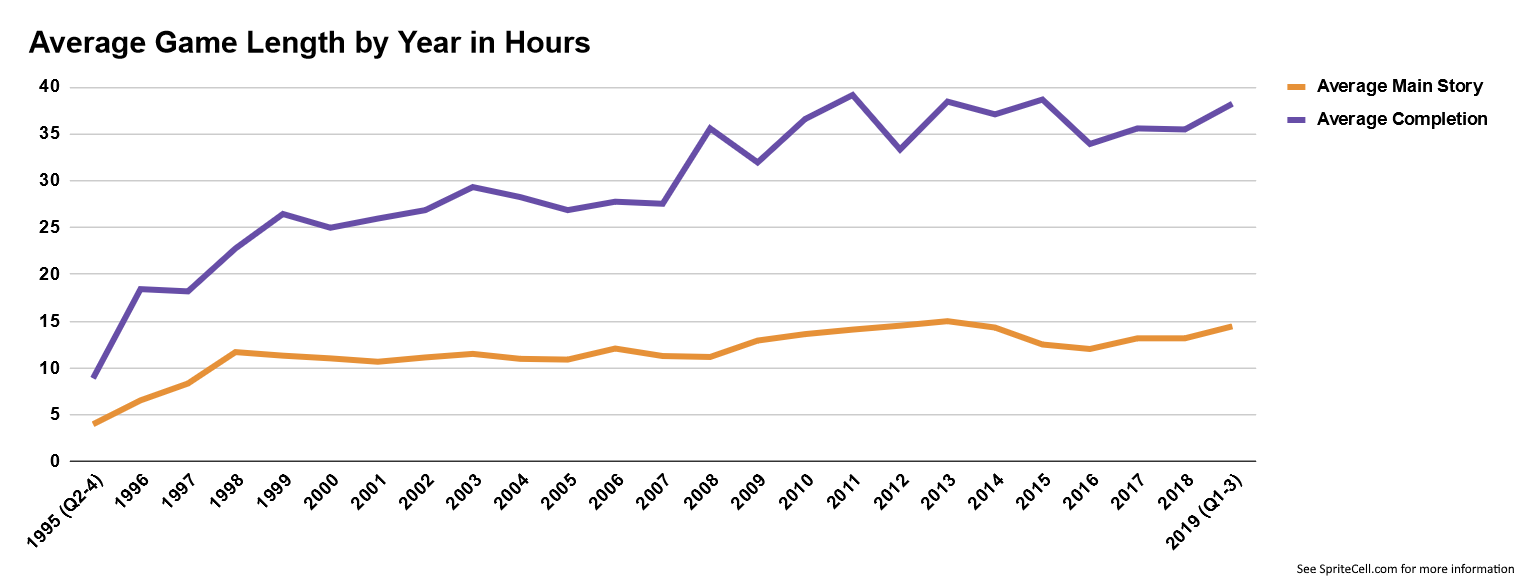
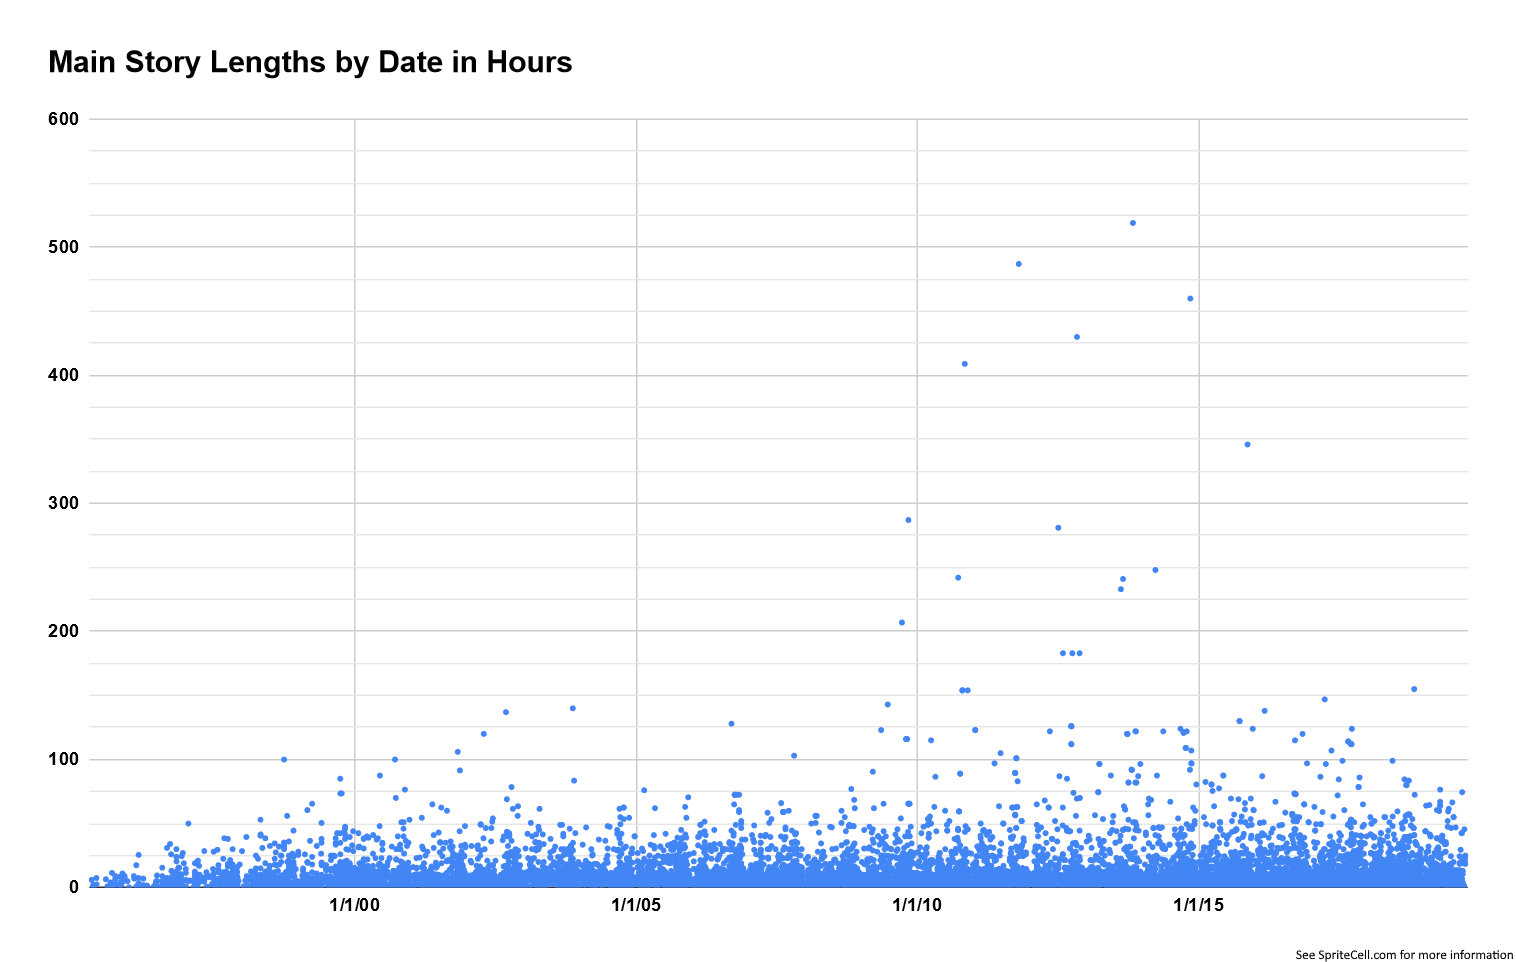
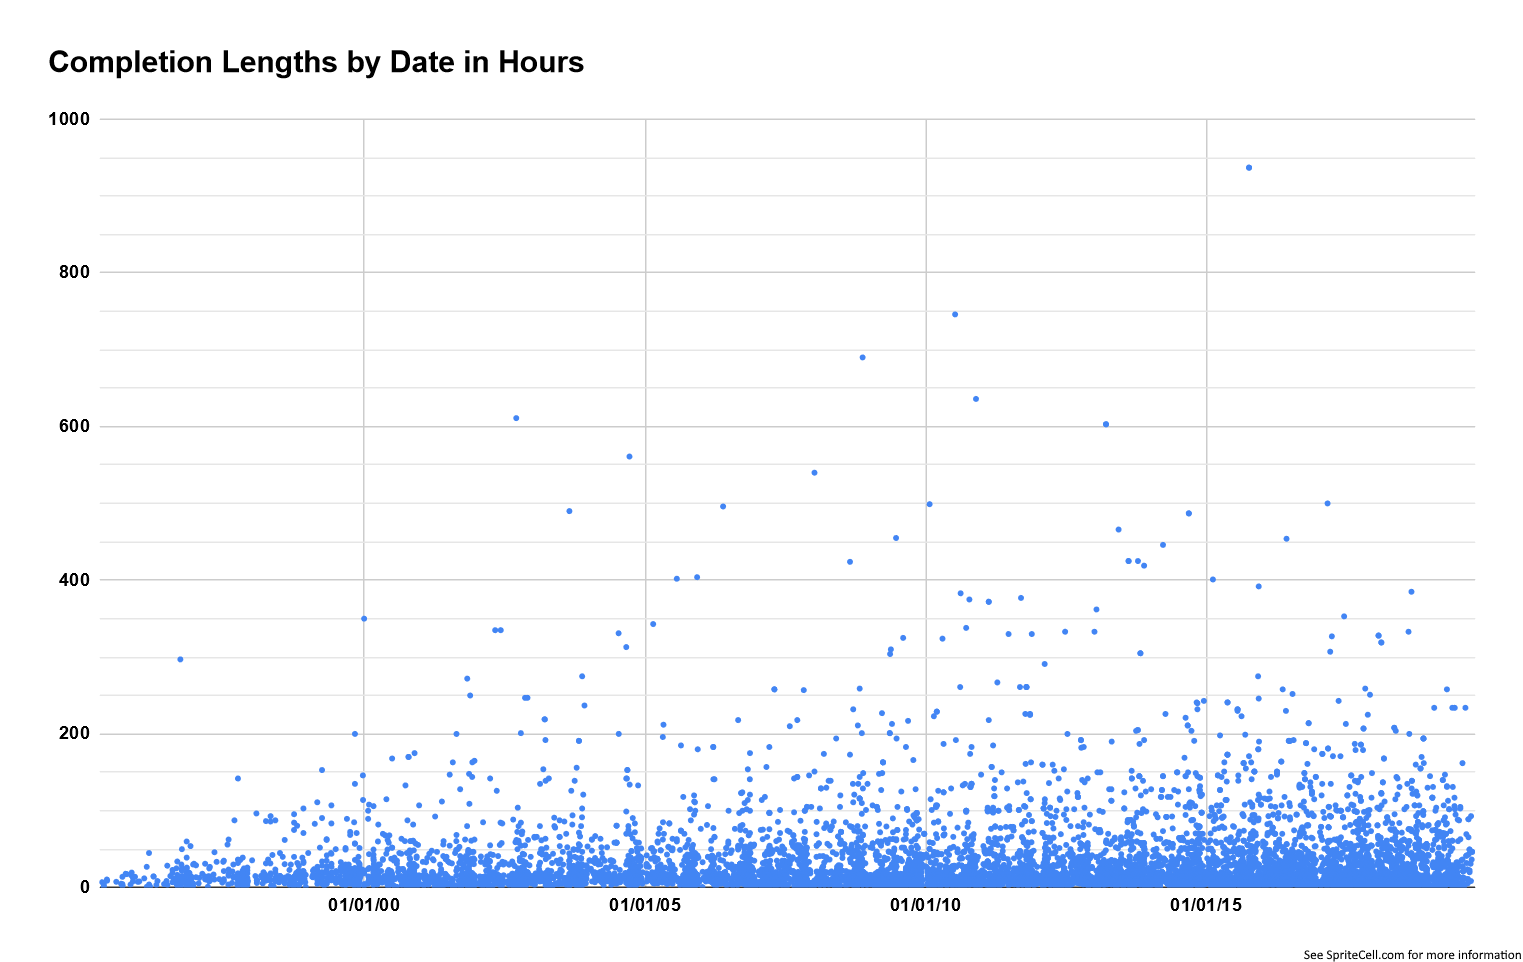
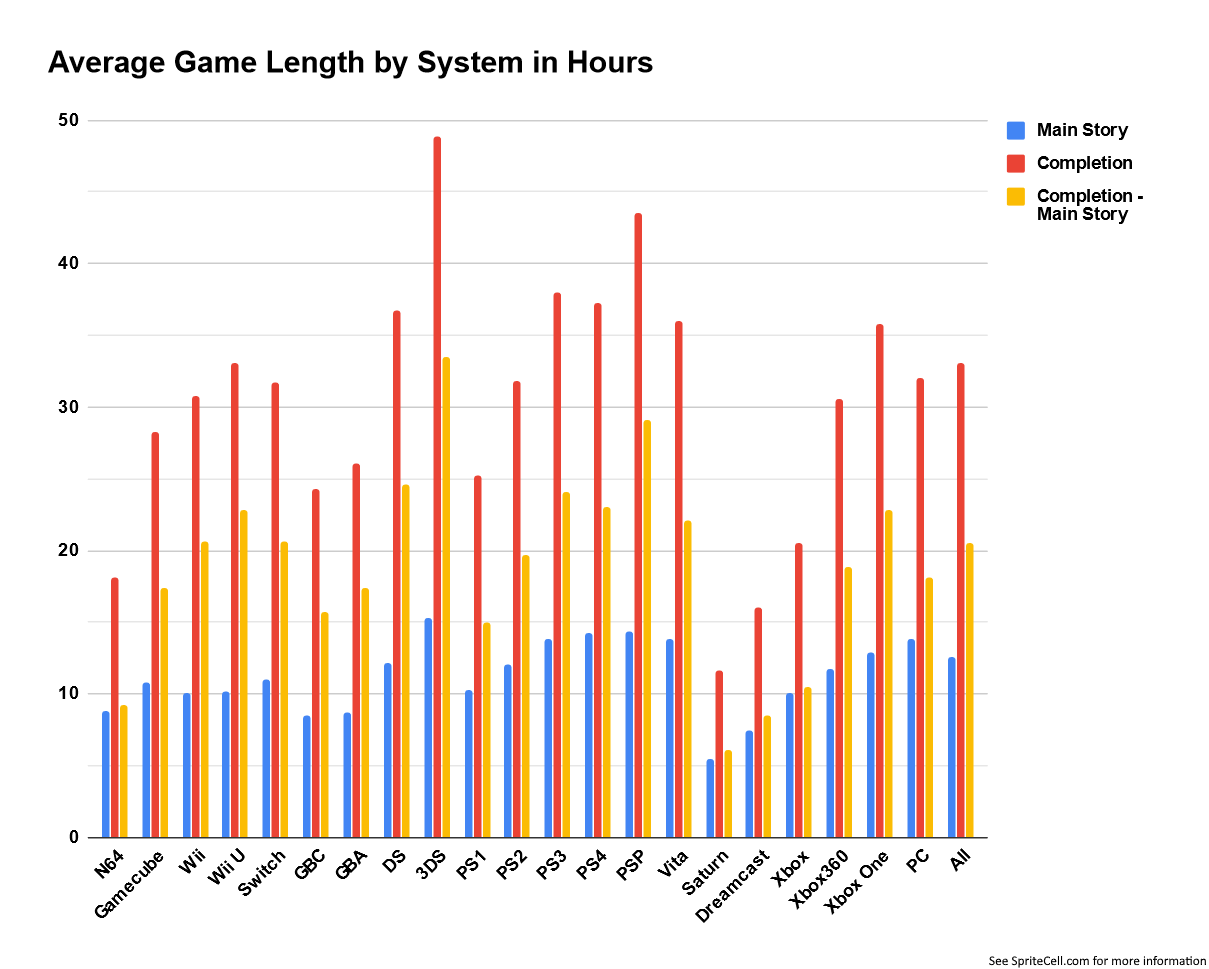
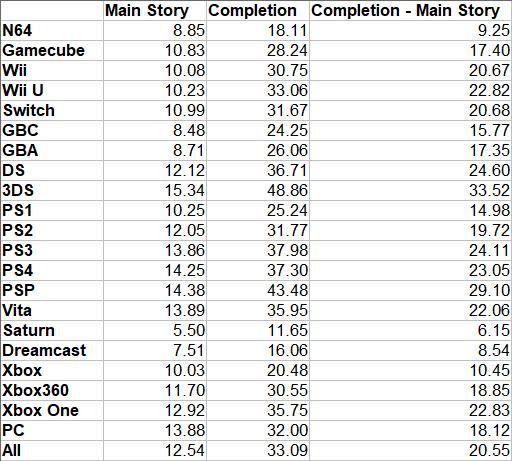
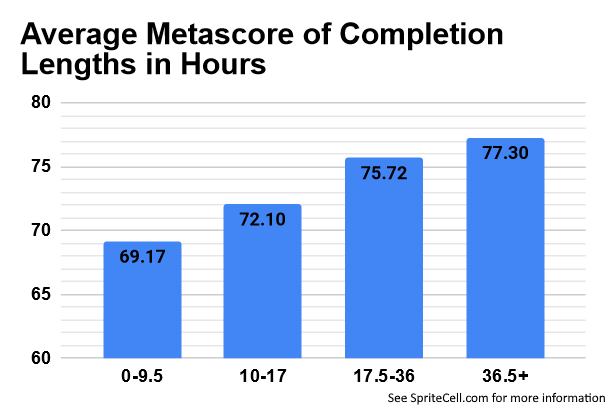
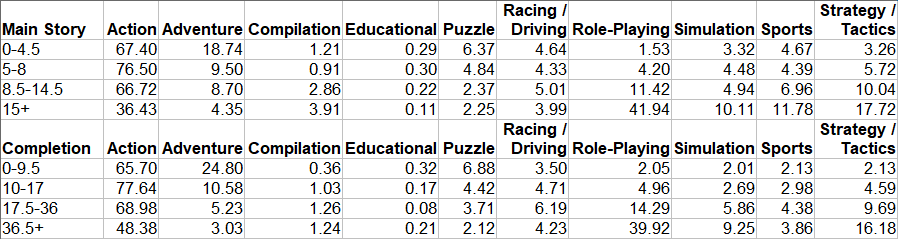
ESRB Ratings + Game Lengths

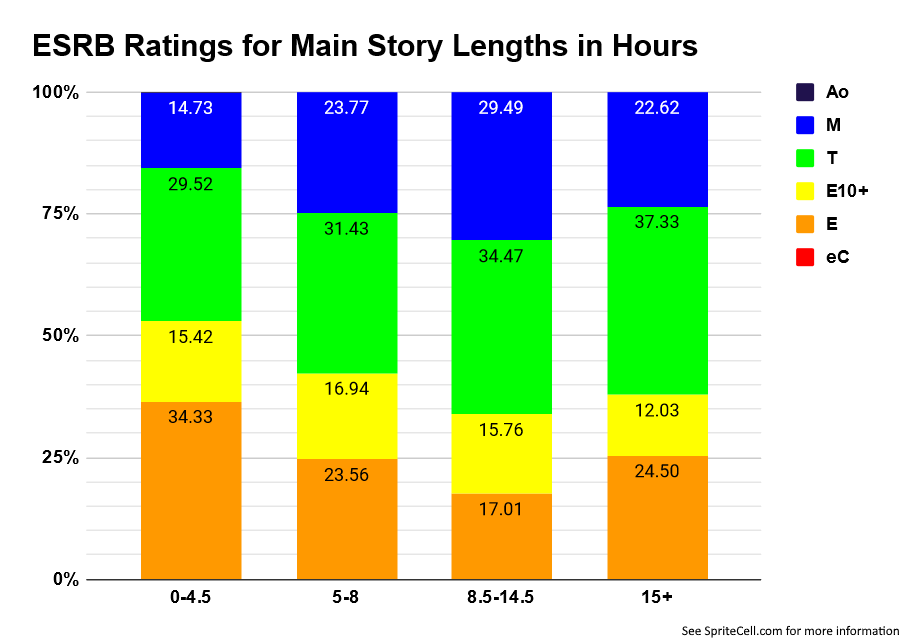
Games tend towards the Mature rated side of the scale the longer they are, although the longest main stories are a bit of an exception. Role-Playing games are such a large part of the longest buckets that their overall more adult ratings push things in that direction. Longer games also have more opportunities to present scenes that earn severe content descriptors such as Strong Language, Strong Sexual Themes, and Mature Humor.

But more on that next time, where I’ll go into more depth about content descriptors than you ever imagined possible.

Sources

GameRankings.com for metascores and some release dates. Archives: 1, 2, 3

MobyGames.com for genres, some release dates, some ESRB ratings, and some ESRB content descriptors

HowLongToBeat.com for main story and completionist times.

ESRB.org for ESRB ratings and ESRB content descriptors

Wikipedia for its many lists of games

Game Lengths Background

The first part of this project has some important context about how this study was conducted.

Today’s post is all about how long it takes to complete a game, both the main story, and to complete everything, which I will refer to as “game lengths”.

The data is from HowLongToBeat.com which takes user-submitted times which are averaged. This is the smallest data set involved in this study, only about half of the games included in the study had main story times, and about 40% had completionist times. The site also allows users to submit “Main + Extras” times in between Main Story and Completionist, which I found too vague and not very interesting. Most people aren’t submitting “I did the bare minimum” times for Main Story.

I didn’t include games that use the Solo/Co-Op/Vs. categories, which are mainly used for games that are solely PvP. There were a number of games that seem to have been given this designation in error.

There is a quirk with how HowLongToBeat.com displays information. Games under an hour long will display the number of minutes, while games an hour or longer will display X or X.5 hours. I suppose this is to make things look tidy, but it’s an unfortunate loss of detail.

Game Lengths – General

Games have gotten longer over time, but the gap between just beating the game, and doing everything the game has to offer has grown larger over time. Xbox’s achievement system debuted in 2005, while Playstation’s debuted in 2008, which may be responsible for that big completion jump in 2008. Game developers may have started designing their games with an idea in mind of long or difficult it should be to get every achievement and were afraid of making their games too short. A contributing factor may also be that people were less sure when to call a game “completed” when playing games without achievement systems.

Every game with game length data. These scatter plots give you an idea of the overall distribution of game lengths and how far the outliers are from the norm. There are so many types of games, and so many ways to play them. Less than a fourth of games make it beyond the first minor gridline of 25 and 50 hours, respectively.

I know you’re curious about those longest games. The longest main story games were 7 Football Manager games (2010-2016) at 287 to 519 hours. After that are The Secret World (281) , Destiny of Spirits (248), and Final Fantasy XIV (242).

For completion times we have Rock Band 4 on two different systems at 937 hours, followed by Dragon Quest IX (746), Animal Crossing: City Folk (690), and Gran Turismo 5 (636).

As someone that has played a lot of 3DS I never would have guessed it has the longest games on average. Sega was known for arcadey games that emphasized replaying over and over for better scores or times, so it makes sense to see Saturn and Dreamcast so short.

The structure of games can vary quite a bit, beating a fighting game’s campaign mode will almost always take under an hour, so systems with lots of fighting games may be skewed shorter, while people are likely to do many optional side quests in already long RPGs.

With these direct comparisons it we can see that handheld games don’t really have a tendency to be shorter than their console siblings, with the DS, 3DS, and PSP beating their console counterparts.

Although the trend is for games to get longer over time, the Wii is a notable example of games getting shorter compared to its predecessor, though only for main story.

Game Lengths + Metascores

I broke up the lengths of main story and completion into 4 buckets that each have approximately the same number of games.

People like long games. There may also be a correlation between game length, budget, polish and refinement.

Game Lengths + Genre

No surprise that Role-Playing comes out as the longest genre, with a big gap between main story and completion. I might have expected Strategy / Tactics to take second over the grab bag of games that make up Simulation. Despite a fair number of long visual novels Adventure comes in short due Western episodic games. It’s interesting that a Compilation of several games is still on average shorter than an individual game of several genres.


And here is how the genres are distributed in the 4 buckets. Adventure and Puzzle are the only genres that consistently become rarer as we increase time. Role-Playing really has the biggest difference between the shortest and longest bucket.

This post was a bit short, but we’re adding more and more combinations of metrics. Next time is ESRB ratings.

Sources

GameRankings.com for metascores and some release dates. Archives: 1, 2, 3

MobyGames.com for genres, some release dates, some ESRB ratings, and some ESRB content descriptors

HowLongToBeat.com for main story and completionist times.

ESRB.org for ESRB ratings and ESRB content descriptors

Wikipedia for its many lists of games

Genre Background

The first part of this project has some important context about how this study was conducted.

I searched several sites with large video game databases to decide how I was going to approach the genre section. I wasn’t totally satisfied with any of them, but I found MobyGames to be the best compromise. GameFAQs has an odd tiered system with a variable number of tiers that is inconsistent about describing certain aspects that I wouldn’t exactly call genres. GiantBomb was inconsistent and less complete. I made a list of 30ish tricky games to assign genre to and looked them up on 4 sites, and MobyGames seemed the best to me. I’m still about to point out a lot of issues, but no genre system is going to be perfect. MobyGames is also essentially a tightly controlled wiki, but things slip through the cracks and don’t get fixed, so I made changes and made things more consistent when it seemed obvious.

MobyGames has 10 genres: Action, Adventure, Compilation, Educational, Puzzle, Racing / Driving, Role-Playing (RPG), Simulation, Sports, Strategy/Tactics. That’s verbatim, and yes it drove me crazy how Racing / Driving has a space on either side of the slash, but Strategy/Tactics doesn’t, and we’re reminded how Role-Playing games are abbreviated. Games can be labeled with as many genres as needed.

Action is very general, covering fighting games, music and rhythm games, platformers, first-person shooters, and sometimes seemingly anything that isn’t turned based or menu driven. Some Sports games included it and some didn’t, confusingly. I made an effort to make it more consistent by removing it from any games that were more on the “sim” side, that weren’t arcadey or had an Actiony side mode.

Adventure, as MobyGames defines it, focuses on narrative over action, and emphasizes dialog and puzzle solving. Includes visual novels, point and clicks, walking simulators, and many games without combat.

Compilations have multiple games in one package. Does not include minigame collections like Mario Party. I removed compilation from many games that included DLC that was sold separately in a previous release, only full games put together counted for this project.

Educational doesn’t seem like it should be a genre at all to me, but these are mostly games for young children about the alphabet or basic math.

Puzzle seems to be used exclusively for games that are all about puzzles, not games that have some puzzles to solve, like the Legend of Zelda series.

Racing / Driving is included in some games with vehicular minigames or sections, like Grand Theft Auto.

Role-Playing games includes games like Dark Souls and Monster Hunter as well the The Elder Scrolls, Final Fantasy, and Persona.

Simulation for our purposes includes Cooking Mama, Nintendogs, most of the Imagine and Petz series, Phoenix Wright, and Guitar Hero. This is probably the most eclectic genre.

Sports includes wrestling, hunting, billiards, fitness, and some horse games.

Strategy/Tactics includes the Jackbox games, city builders, war games, board games, card games, and the Worms series.

Genre – General Distribution

Overall, nothing comes close to action. Yearly releases of many sports games keeps them the second most common. Role-Playing is higher than I would have expected, especially compared to Racing / Driving games.

I really like this chart, you can see how the industry has changed and how what kinds of games it makes has evolved over time. Although classic point-and-click adventures are rare now, the genre has managed to become the second largest. Some of this is because many adventure games are released episodically, and then bundled, resulting in a lot of separate game entries.

Sports games have actually become less common over time, perhaps it’s become too hard to compete with the big franchises?

PC is really an outlier here, where in other metrics it’s very close to the overall average due to making up about a fifth of the games included. It’s difficult to really see any trends among hardware companies. The time period a system exists in is probably much more important.

A bit easier to see some minimums and maximums here. Playstation Vita just barely coming out on top for RPGs. Switch really has a different makeup than other Nintendo consoles or handhelds have had. Lots of Racing / Driving games in the 5th generation. The N64 somehow has the largest percentage of Sports titles in its library.

Genre – Genre Combinations

Since games can have any number of genres, let’s look at what Action appears alongside. Not too hard to apply Action to any other genre.

Adventure games come packaged in Compilations fairly often. Almost every Adventure game released episodically eventually had a Compiled edition. I can’t think of any Racing / Driving or Sports games that were also Adventure games. Let’s see, Barbie Horse Adventures: Riding Camp is listed as Adventure and Sports, Yakuza Kiwami 1 and 2 are too (with Action as well). That’s one thing they have in common.

As said before, lots of Adventure Compilations, but a surprising number of Puzzle games in Compilations too.

There are so few Educational games that we can expect a very different graph.

“What is a Puzzle and Sports game?”, you may be asking. A few include Pocket Card Jockey, Vertigo, and Clubhouse Games.

Surprisingly few Racing / Driving games are purely their own genre. Simulation seems like a natural pairing. Racing / Driving games that are also Adventure games include Nancy Drew: The Mystery of the Clue Bender Society and L.A. Noire.

Strategy/Tactics games are a natural fit for RPG mechanics, while driving a car isn’t. I just checked and Final Fantasy XV didn’t count as a Racing / Driving game for some reason.

Simulating playing a Sport or Racing a car make sense, while other genres probably have a side mode or minigame with some kind of Simulation.

Most Sports games don’t intermingle other genres into their gameplay.

Strategy/Tactics games are often about solving the puzzle of how to win, but few are also Puzzle games.


The above graphs in chart form. Here we can see the least combination of genres is Role-Playing and Educational, which makes good sense, these genres serve very different groups and tend to have very different budgets. There were only three such games: Fossil League: Dino Tournament Challenge, Bookworm Adventures, and Bookworm Adventures: Volume 2.

Here is an overall look at what percent of games are one genre. This is different than the previous “This Genre Alone” statistics because those were only considering the subset of games with a particular genre.

Genre and Metascore

The y-axis of this graph starts at 60 to make the differences more apparent, but keep in mind the range of values is 5.13. Action is by far the most common genre, but has the second-lowest average score. Compilation’s high scores could be influenced by the perceived value of a good cost to gameplay time ratio.

And here are the the genres of the best-reviewed games. Adventure, Puzzle, Simulation, and Strategy/Tactics all pretty low considering how many games of each there are.

That’s all for genres, next time it’s completion times.

Sources

GameRankings.com for metascores and some release dates. Archives: 1, 2, 3

MobyGames.com for genres, some release dates, some ESRB ratings, and some ESRB content descriptors

HowLongToBeat.com for main story and completionist times.

ESRB.org for ESRB ratings and ESRB content descriptors

Wikipedia for its many lists of games

Introduction

This study covers 23,630 games for 21 systems and 8 metrics of information: release date, system released on, critical metascore, genre(s), length of time to beat the main story, length of time to complete everything, ESRB ratings, and ESRB content descriptors. These games were all released in North America between the second quarter of 1995 and the third quarter of 2019. The selection of games is not comprehensive of anything, it is a sample, and it is important to know how the games were chosen.

I started with games that had at least 5 critical reviews on GameRankings, a now-closed review aggregator which was similar to Metacritic, but had some great sorting options. I chose GameRankings over Metacritic  because of those sorting options and because it included older games. Although it had 4th generation games it was mostly the greatest hits of the era, so I started with 5th generation games. I included all systems from the “Big Four” (Nintendo, Sony, Sega, Microsoft) and the PC from the 5th generation to the current 8th generation. I also chose to start at the 5th generation because the ESRB didn’t start rating games until partway through the 4th generation and this way all the games included could potentially have data for each metric. For some systems I included the full list of games from wikipedia. For example, I included all 3DS games because only about 40% of its library has a metascore. For PC games I instead needed a way to cut down the number of titles, so every PC game with a GameRankings metascore was included.

All games had to have a release date, this actually disqualified some older games with unknown dates. One issue I ran into was many PC games from 1995 to 1997 supposedly had release dates on the last day of the month, way too many to be a coincidence. Multiple sources listed the same release dates, but I wasn’t able to find any information as to whether this was just when games were released at the time or if only the approximate release date is known and everyone decided to just round to the nearest last day of the month and offer no disclaimer that it is only an estimate.

All games had to have a genre. I’ll go into more detail on this later, but my genres were from MobyGames, which had genres listed for almost every game. For some of the few games without genres listed, I did my best to guess how MobyGames would have assigned it.

For games that are released on multiple platforms each occurrence is counted as a separate game. Although they are usually almost identical, exceptions do exist, and review scores are often a bit different even when games perform the same on different platforms.

All non-PC games had to have an ESRB rating. PC games were excluded because quite a few PC games, even some big exclusives, don’t have ratings. This was an issue with some obscure digital-only games, especially ones that had been removed from stores.

No expansion packs or DLC were included, unless they could be played without the base game.

So ultimately we have 23,630 games, all with release dates, genres, and systems. 17,192 have metascores, 12,652 have time to complete main story, 9,687 have completionist times, 22,651 have ESRB ratings and content descriptors.

This was a mammoth project, probably the largest I’ll ever do at once, that took over 9 months. It is complete, but it is so large (over 100 images) that I will be posting it in several chunks while I work on other projects. It will be 5 parts total (plus some bonuses) going over each metric, and also the interesting combinations.

Here is how the games included number by year. Note that this is not meant to be fully proportional to how many games were actually released each year. Some of the by-year graphs will have big swings in the first few years, this is because there weren’t many games included for those years. The Wii was released in 2006 and Steam Greenlight debuted in 2012, two platforms that attracted a lot of new developers and may be responsible for big increases in the number of games released shortly thereafter.

Metascores – General

First, let’s look at metascores. I got all of my data from GameRankings a few months before it was shut down. While I’m saddened that this easy to use site was shut down, there are some archives if you want to see it: The Internet Archive has a full copy, there is an archive website created by someone named Matúš, and they also have a google spreadsheet of all the scores.

Usually when you hear about game metascores, it is Metacritic’s metascore. GameRankings metascores were very similar, rarely ever more than 2 points different, but they included different review outlets. However, unlike Metacritic, they seem to use a straight average, rather than weighing some outlets more than others. They also give metascores with accuracy to hundredths digit.

Let’s start with the average metascore by year. A pretty steady increase in scores for over a decade. This may not be entirely about the quality of the games released, but rather have more to do with outlets reviewing fewer small digital-only titles, but this is speculation. One has to wonder what caused the 2006-2008 crater. This video of a GDC talk by EEDAR blames the Wii alone for a dip in review scores in 2006 and 2007, but their data looks a bit different than mine. This article about a reddit post focuses on 2007 and theorizes about the Wii, but also budget PS2 and DS games.

But maybe you want to argue about which system has the best games. Here we have the averages, worst rated, and best rated game for Nintendo systems. For the mode on all of these metascores I rounded the scores to the nearest whole number, otherwise you end up with the mode occuring 2 or 3 times and not having much to do with the typical game. The Wii and DS do have the lowest averages, giving some weight to them dragging down the overall average. The Wii U did better than you might expect, although there’s plenty of RCMADIAX games that weren’t included. The Switch comes out on top, a real crowd pleaser despite a glut of shovelware.

You’re probably shocked that the Sega Saturn has the highest GameRankings metascore. It’s worth an asterisk because it has the same problem as systems from the previous generation: only the cream of the crop were included. GameRankings launched in 1999, the same year as the Dreamcast was released, so they would have had to go through old magazines and website reviews to record scores, and they must have prioritized the most popular games, moreso than the N64 or PS1. In fact, there are about one ninth as many Saturn game reviews as N64. A contributing factor may also be that publications just weren’t interested in reviewing the more average Saturn games, due to its low sales in North America.

Here’s all that system data in a nice chart, including the overall. A lot of Rockstar games topping the system bests. I find it interesting how many of the worst games aren’t even famous for being bad, they were just quietly forgotten. But who could forget the classic Metal Gear Solid? For Game Boy Color. We can also see that the best selling console or handheld never has the highest average score compared to its competition.

Let’s go deeper, here’s every Nintendo system’s average metascore by quarter. Something to note is that some quarters, especially the first and the last several, only have 1-4 games, causing some large swings. That last Wii U quarter is less impressive when you consider it was solely Breath of the Wild.

There were also a few quarters with no scored games in between quarters that did have them. Lines have been connected in between data points. That said, the general trend seems to be upward, especially with the 3DS.

The PS1 has the distinction of the worst quarter ever. The only game with a GameRankings metascore for that quarter was Dragon Ball Z: Ultimate Battle 22 which got a 32.03. I apologize but in finding out that tidbit of information I see that I did not include Q2 2003 for the PS1. Three games from that period average 67.68.
These charts are fairly good at showing how system’s life spans overlap, quite a few years had three Sony systems coming out with new games worth reviewing, 2014 even had four!

The short life of the Saturn and Dreamcast can be seen here. Xbox consoles seem to have a shorter overlap than Playstation. Overall, these charts make it hard to point to any “golden age” for a system, ratings jump up and down all the time.

In case you don’t like all of those lines, here’s the full chart, with the PS1 correction. There were quite a few gaps late in the PSP’s life.

People often refer to a lack of games and a lack good games during the first part of the year. And during the summer. Here I took every game with a metascore and changed the release year to 2000 to find when the best and worst games are released throughout the year. Daily scores are all over the place, there’s not much to glean from them. 12/28 is the highest, but only 4 metascored games were released that day.

Weekly averages have more of a story to tell but still have some odd peaks and valleys. Monthly averages show a gradual rise and fall, but only vary by about 3 percent.

The raw numbers show August, September, and October as the critical highlight of the year, quickly followed by the December and January low points. Despite August’s strong performance, it has the weakest day of the whole year on the 4th. The highest rated months also seem to have daily values that are less variable.

Metascores – Specifics

Sure, 70.25 might be the overall average metascore, but how are those distributed? While scores have crept up over the years, 90+s have consistently stayed under 5%. On the other end of the scale games scoring under 60% aren’t a whole lot more common.

Percentiles are the value needed to be in the top x% percent(ile). So if you get a 95% on a test in a class of 100 students, and only one person scored better than you, you would be in the 99th percentile and the value of the 99th percentile is a score of 95. The 100th percentile is the highest score, and the 0th percentile is the lowest.

I should have reversed the order of the legend, oops. Just over an 85% metascore will put a game among the 10% highest rated. The gaps between percentiles get larger the lower you go, but overall they are pretty evenly spaced among their small range.

The standard deviation is a measure of how much values disperse (deviate) compared the average (standard). A low standard deviation means values are mostly close together, of which game metascores are an example, and they have become closer for several straight years.

You really like numbers if you look through this chart detailing the last three graphs.

Metascores – 90+

Games that score at least a 90 can be considered the very best games with cross-genre appeal that are part of the conversation about the best games of all time, classics that are discussed for many years. The number of 90+ games doesn’t follow average review scores too closely, although 2006 is still a bad year. Keep in mind I have few games from 1995-1997, I know a lot of great stuff came out then, this is not percent based at all. Even with average review scores creeping upward, the number of 90+ games has generally gone down. Do you think 2003 really had a classic coming out more than every other week on average?

Keep in mind that pre-1999 games were more likely to be included if they were the best and most famous games. 2006 is again a low point, but we can see 2011 being a turning point as well. My cutoff was before the likely highest scoring time of year for 2019, so it probably wouldn’t be as low as shown here if I included all of it.

But enough about percentages, maybe you just want to buy the system with the most high quality games available. Well, you can’t go wrong the system that has been around the longest, the PC. But to put that into perspective, if we consider the average system’s lifespan to be 6 years, then the PC has been around for 4 and one sixth system lifespans (for the purposes of this 25 year study). If we divide that 97 by 4 and one sixth, we get an average of 23.28 per system lifespan, pretty close to the Gamecube. At 5 year lifespans, 19.4.

The massive libraries of the PS2, PS3, and Xbox 360 help them achieve top status if we disregard the PC. Other than the exceptionally successful PS2 the numbers remain pretty close between Sony and Microsoft when comparing competing consoles. The Dreamcast had quite a few in its short lifetime.

That’s all for this post, next up is genres.

Sources

GameRankings.com for metascores and some release dates. Archives: 1, 2, 3

MobyGames.com for genres, some release dates, some ESRB ratings, and some ESRB content descriptors

HowLongToBeat.com for main story and completionist times.

ESRB.org for ESRB ratings and ESRB content descriptors

Wikipedia for its many lists of games


I was really excited to do this one, I buy almost all of my games used and wanted to quantify some things people kept repeating about prices. Originally posted on reddit.

People often say that Nintendo games are more expensive, or even that they never go down in price. Sometimes people clarify that they only mean first party titles. As someone interested in collecting I’ve been curious about this for some time, so I decided to look into the average price of games on different platforms. I entered the prices of 50 games in loose, complete in box (CIB), and new condition for 19 systems, generations 5 through 8.

Since I grouped by company, here are the generations for reference:

  • 5th: N64/Playstation/Saturn
  • 6th: Gamecube/Gameboy Advance/Playstation 2/Dreamcast/Xbox
  • 7th: Wii/DS/Playstation 3/Playstation Portable/Xbox 360
  • 8th: Wii U/Switch(I guess)/3DS/Playstation 4/Vita/Xbox One

Some notes and takeaways

None of Switch’s games are even a year old yet, while most of XBone’s and PS4’s are, which is part of why its games are so expensive. I also had to include almost every physical release on the Switch, so there is some obscure stuff there.

Nintendo games are indeed more expensive on average, although I expect the gap to be smaller when the Switch is as old as the PS4, and 3DS is basically tied with the Vita.

One to two generations old seems to be the sweet spot for cheap games.

The Xbox 360 has the cheapest games on average, but Xbox, PS2, and PS3 are pretty close.

I thought first party games would be consistently more expensive than third across the board, but it was only true for Nintendo games (sans DS) and Saturn.

The Gamecube had the largest difference between first and third party prices.

Some systems had many more first party titles among the games I used than others (N64, Wii, DS), so the third party prices could be fairly different if more games were included.

New prices don’t become too crazy until 3 generations back.

Panzer Dragoon Saga was the most expensive game included – $510.1 CIB, while Madden NFL 2002 for PS2 and World Series Baseball on Xbox were the cheapest CIB at $2.78

2,850 prices were used in total for this data.

Methodology

It’s difficult to know what a good representative sample is, but I wanted to focus on games people are likely to want to buy, and cut out shovelware. First I looked for a wikipedia page like https://en.wikipedia.org/wiki/List_of_best-selling_PlayStation_4_video_games

and added the 15 best-selling. Then, I went to metacritic and added the 15 highest highest rated games that didn’t include anything I’d already added. I filled out the rest by going back and forth between these lists. For systems without a nice wikipedia list, or not featured on metacritic I googled for best of lists.

I only included games released in the U.S. with a physical release. Why only physical? When people discuss these game prices it’s usually in the context of the second-hand collecting market. Digital stores price games based on very different criteria, and there’s less complete data available. This means no DLC, or digital-only, and few indie games were included.

Only the most basic edition of a game was included – no collector’s edition, no Nintendo Selects or Greatest Hits, no plastic instrument bundles.

This method includes a lot of yearly sports titles, which possibly shouldn’t count. The original Xbox’s games are especially sports-laden. I’m not very familiar with these games, but someone who loves sports games, and is buying older games might pick up the ones with the specific mix of mechanics they like, right? Or maybe the ones with team rosters they enjoy. Regardless, I didn’t want to pick and choose which sports titles would count, so I included whatever came up. These sports games are a bit cheaper than other genres (it’s hard to quantify how much cheaper), somewhat dragging down the average price of systems with many of them.

I considered first party to be games published by Nintendo, Sony, Sega, or Microsoft. I originally was considering only games developed by those companies, but things get complicated and subjective quickly that way.

Price data was retrieved from https://www.pricecharting.com/ from late December 2017 to early January 2018. All prices are in US dollars.

If you want to see the whole spreadsheet with the specific games, here you go: https://docs.google.com/spreadsheets/d/1ssPpo68hAx3y2TjZ9I5knR26-qgprINnD0dmegrHfp8/edit?usp=sharing

It’s ugly and I didn’t care about writing the complete names or fixing typos. Scroll down for the bar graph.