Introduction
This study covers 23,630 games for 21 systems and 8 metrics of information: release date, system released on, critical metascore, genre(s), length of time to beat the main story, length of time to complete everything, ESRB ratings, and ESRB content descriptors. These games were all released in North America between the second quarter of 1995 and the third quarter of 2019. The selection of games is not comprehensive of anything, it is a sample, and it is important to know how the games were chosen.
I started with games that had at least 5 critical reviews on GameRankings, a now-closed review aggregator which was similar to Metacritic, but had some great sorting options. I chose GameRankings over Metacritic because of those sorting options and because it included older games. Although it had 4th generation games it was mostly the greatest hits of the era, so I started with 5th generation games. I included all systems from the “Big Four” (Nintendo, Sony, Sega, Microsoft) and the PC from the 5th generation to the current 8th generation. I also chose to start at the 5th generation because the ESRB didn’t start rating games until partway through the 4th generation and this way all the games included could potentially have data for each metric. For some systems I included the full list of games from wikipedia. For example, I included all 3DS games because only about 40% of its library has a metascore. For PC games I instead needed a way to cut down the number of titles, so every PC game with a GameRankings metascore was included.
All games had to have a release date, this actually disqualified some older games with unknown dates. One issue I ran into was many PC games from 1995 to 1997 supposedly had release dates on the last day of the month, way too many to be a coincidence. Multiple sources listed the same release dates, but I wasn’t able to find any information as to whether this was just when games were released at the time or if only the approximate release date is known and everyone decided to just round to the nearest last day of the month and offer no disclaimer that it is only an estimate.
All games had to have a genre. I’ll go into more detail on this later, but my genres were from MobyGames, which had genres listed for almost every game. For some of the few games without genres listed, I did my best to guess how MobyGames would have assigned it.
For games that are released on multiple platforms each occurrence is counted as a separate game. Although they are usually almost identical, exceptions do exist, and review scores are often a bit different even when games perform the same on different platforms.
All non-PC games had to have an ESRB rating. PC games were excluded because quite a few PC games, even some big exclusives, don’t have ratings. This was an issue with some obscure digital-only games, especially ones that had been removed from stores.
No expansion packs or DLC were included, unless they could be played without the base game.
So ultimately we have 23,630 games, all with release dates, genres, and systems. 17,192 have metascores, 12,652 have time to complete main story, 9,687 have completionist times, 22,651 have ESRB ratings and content descriptors.

Here is how the games included number by year. Note that this is not meant to be fully proportional to how many games were actually released each year. Some of the by-year graphs will have big swings in the first few years, this is because there weren’t many games included for those years. The Wii was released in 2006 and Steam Greenlight debuted in 2012, two platforms that attracted a lot of new developers and may be responsible for big increases in the number of games released shortly thereafter.
Metascores – General
First, let’s look at metascores. I got all of my data from GameRankings a few months before it was shut down. While I’m saddened that this easy to use site was shut down, there are some archives if you want to see it: The Internet Archive has a full copy, there is an archive website created by someone named Matúš, and they also have a google spreadsheet of all the scores.
Usually when you hear about game metascores, it is Metacritic’s metascore. GameRankings metascores were very similar, rarely ever more than 2 points different, but they included different review outlets. However, unlike Metacritic, they seem to use a straight average, rather than weighing some outlets more than others. They also give metascores with accuracy to hundredths digit.

Let’s start with the average metascore by year. A pretty steady increase in scores for over a decade. This may not be entirely about the quality of the games released, but rather have more to do with outlets reviewing fewer small digital-only titles, but this is speculation. One has to wonder what caused the 2006-2008 crater. This video of a GDC talk by EEDAR blames the Wii alone for a dip in review scores in 2006 and 2007, but their data looks a bit different than mine. This article about a reddit post focuses on 2007 and theorizes about the Wii, but also budget PS2 and DS games.

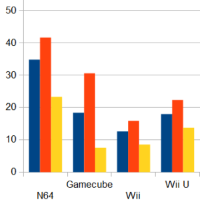
But maybe you want to argue about which system has the best games. Here we have the averages, worst rated, and best rated game for Nintendo systems. For the mode on all of these metascores I rounded the scores to the nearest whole number, otherwise you end up with the mode occuring 2 or 3 times and not having much to do with the typical game. The Wii and DS do have the lowest averages, giving some weight to them dragging down the overall average. The Wii U did better than you might expect, although there’s plenty of RCMADIAX games that weren’t included. The Switch comes out on top, a real crowd pleaser despite a glut of shovelware.
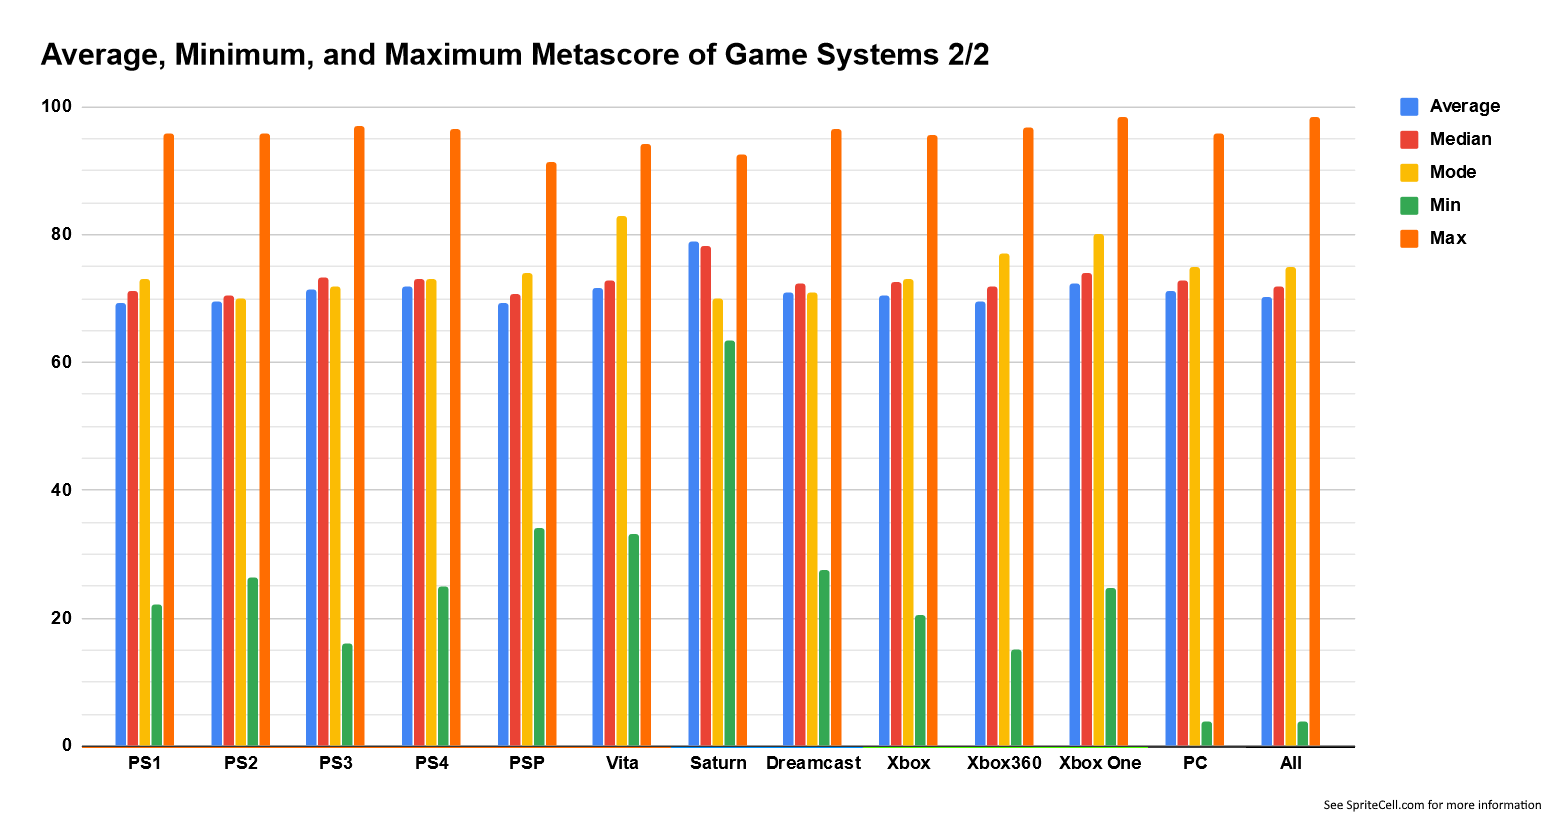
You’re probably shocked that the Sega Saturn has the highest GameRankings metascore. It’s worth an asterisk because it has the same problem as systems from the previous generation: only the cream of the crop were included. GameRankings launched in 1999, the same year as the Dreamcast was released, so they would have had to go through old magazines and website reviews to record scores, and they must have prioritized the most popular games, moreso than the N64 or PS1. In fact, there are about one ninth as many Saturn game reviews as N64. A contributing factor may also be that publications just weren’t interested in reviewing the more average Saturn games, due to its low sales in North America.
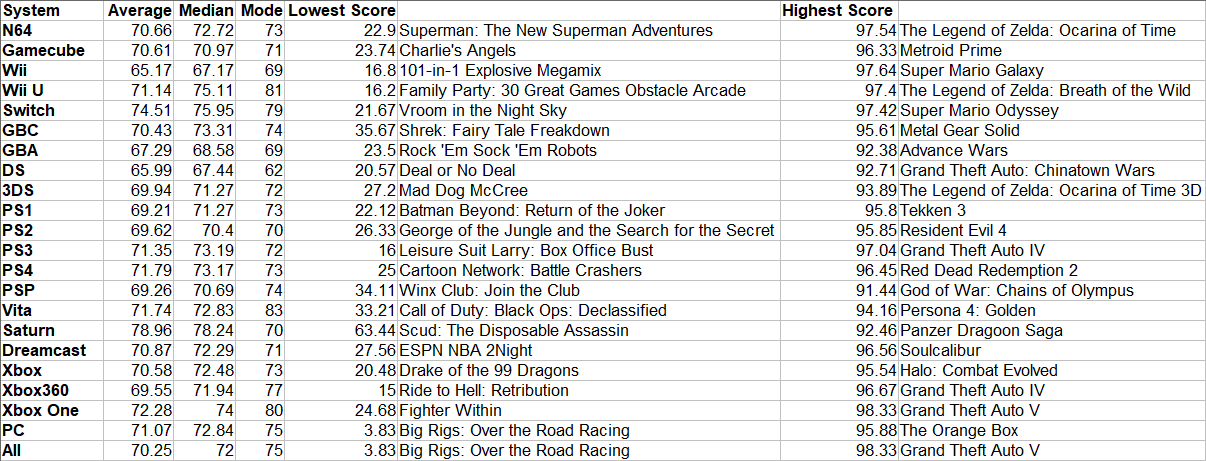
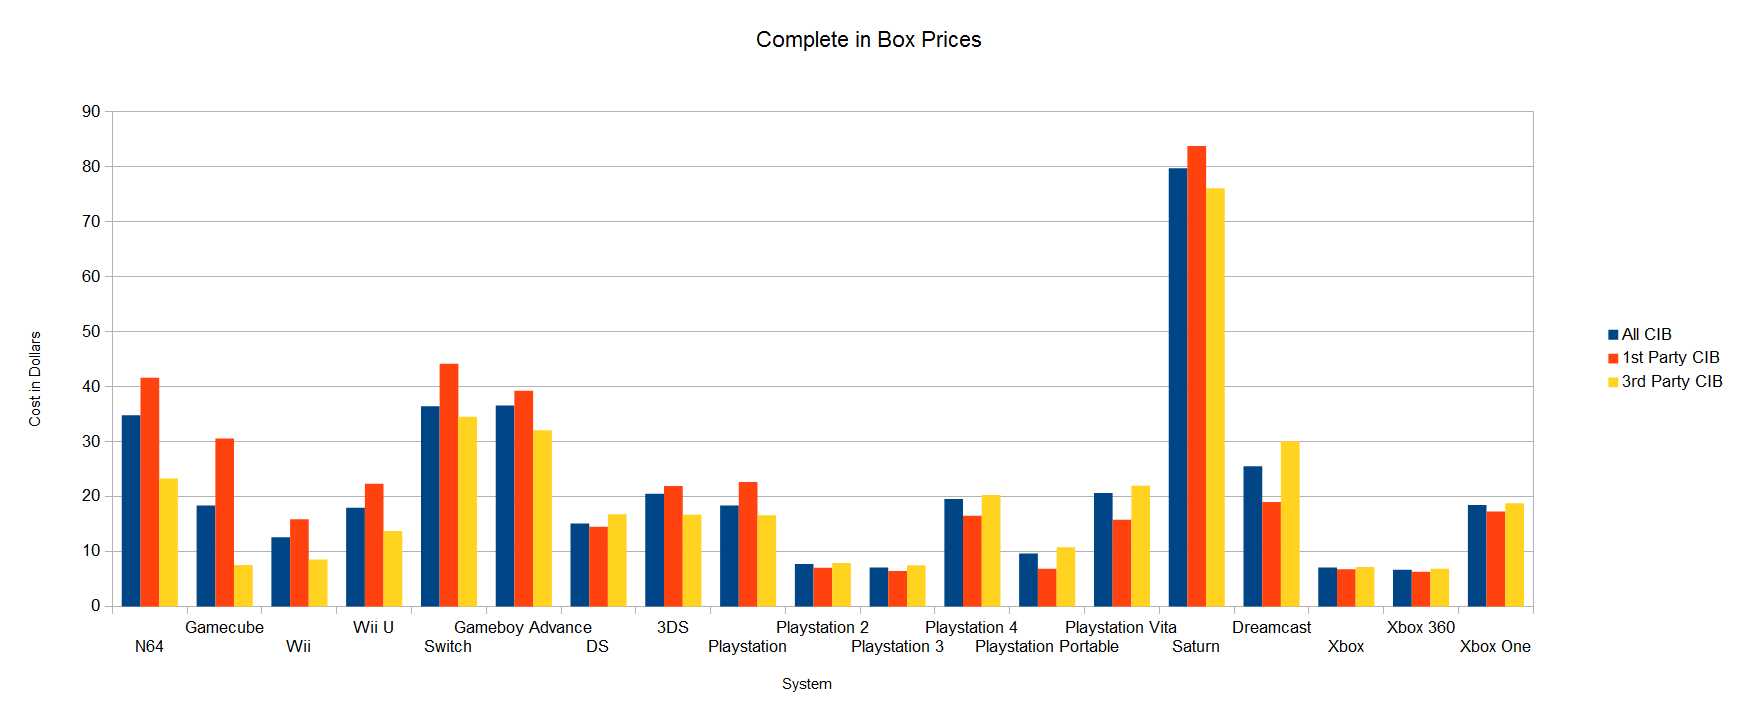
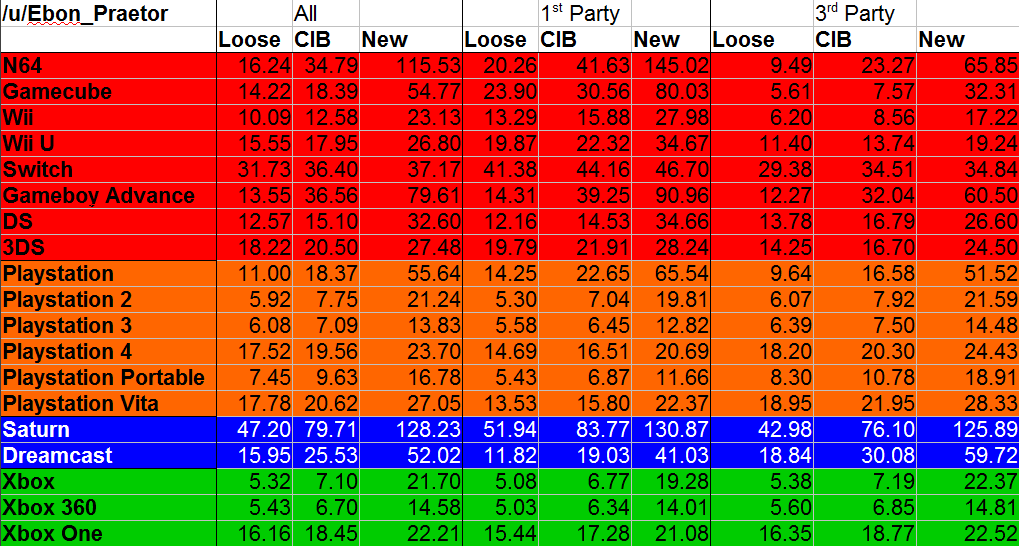
Here’s all that system data in a nice chart, including the overall. A lot of Rockstar games topping the system bests. I find it interesting how many of the worst games aren’t even famous for being bad, they were just quietly forgotten. But who could forget the classic Metal Gear Solid? For Game Boy Color. We can also see that the best selling console or handheld never has the highest average score compared to its competition.

Let’s go deeper, here’s every Nintendo system’s average metascore by quarter. Something to note is that some quarters, especially the first and the last several, only have 1-4 games, causing some large swings. That last Wii U quarter is less impressive when you consider it was solely Breath of the Wild.
There were also a few quarters with no scored games in between quarters that did have them. Lines have been connected in between data points. That said, the general trend seems to be upward, especially with the 3DS.

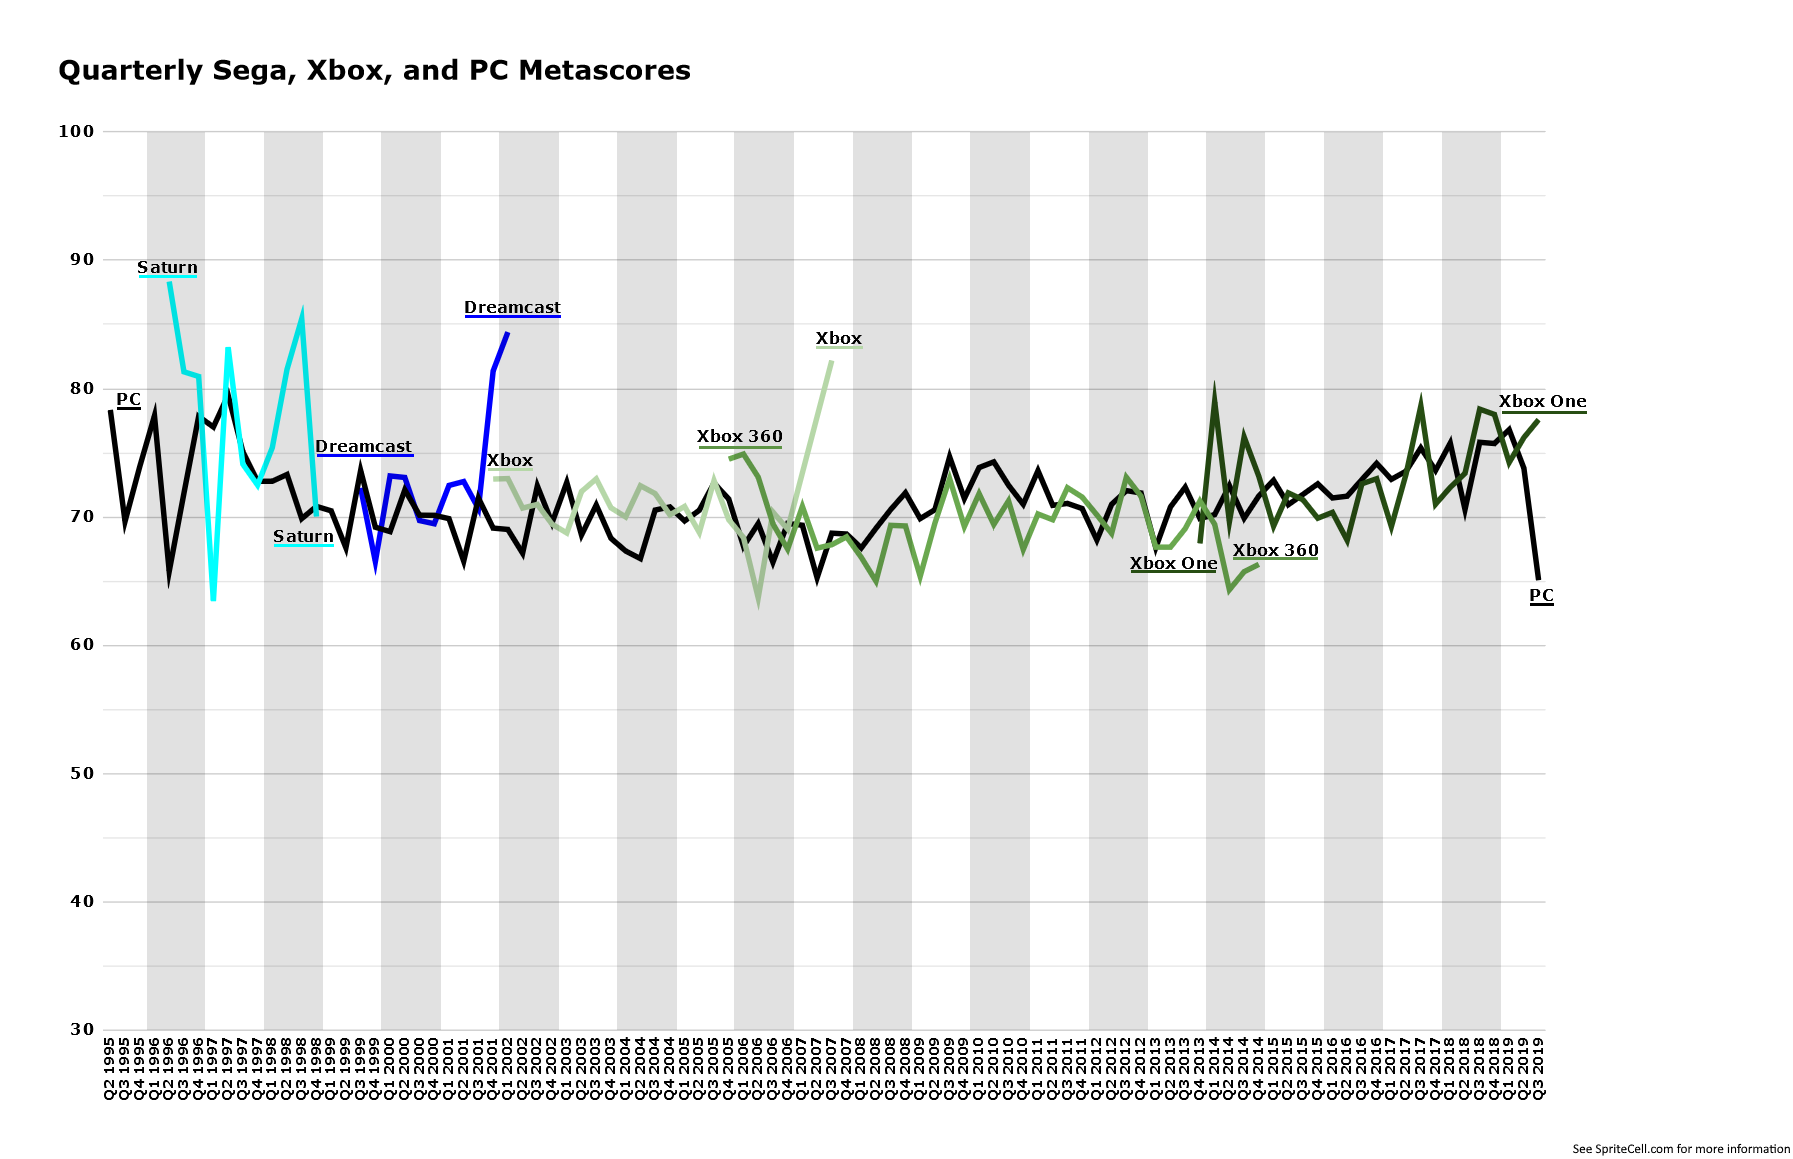
The short life of the Saturn and Dreamcast can be seen here. Xbox consoles seem to have a shorter overlap than Playstation. Overall, these charts make it hard to point to any “golden age” for a system, ratings jump up and down all the time.
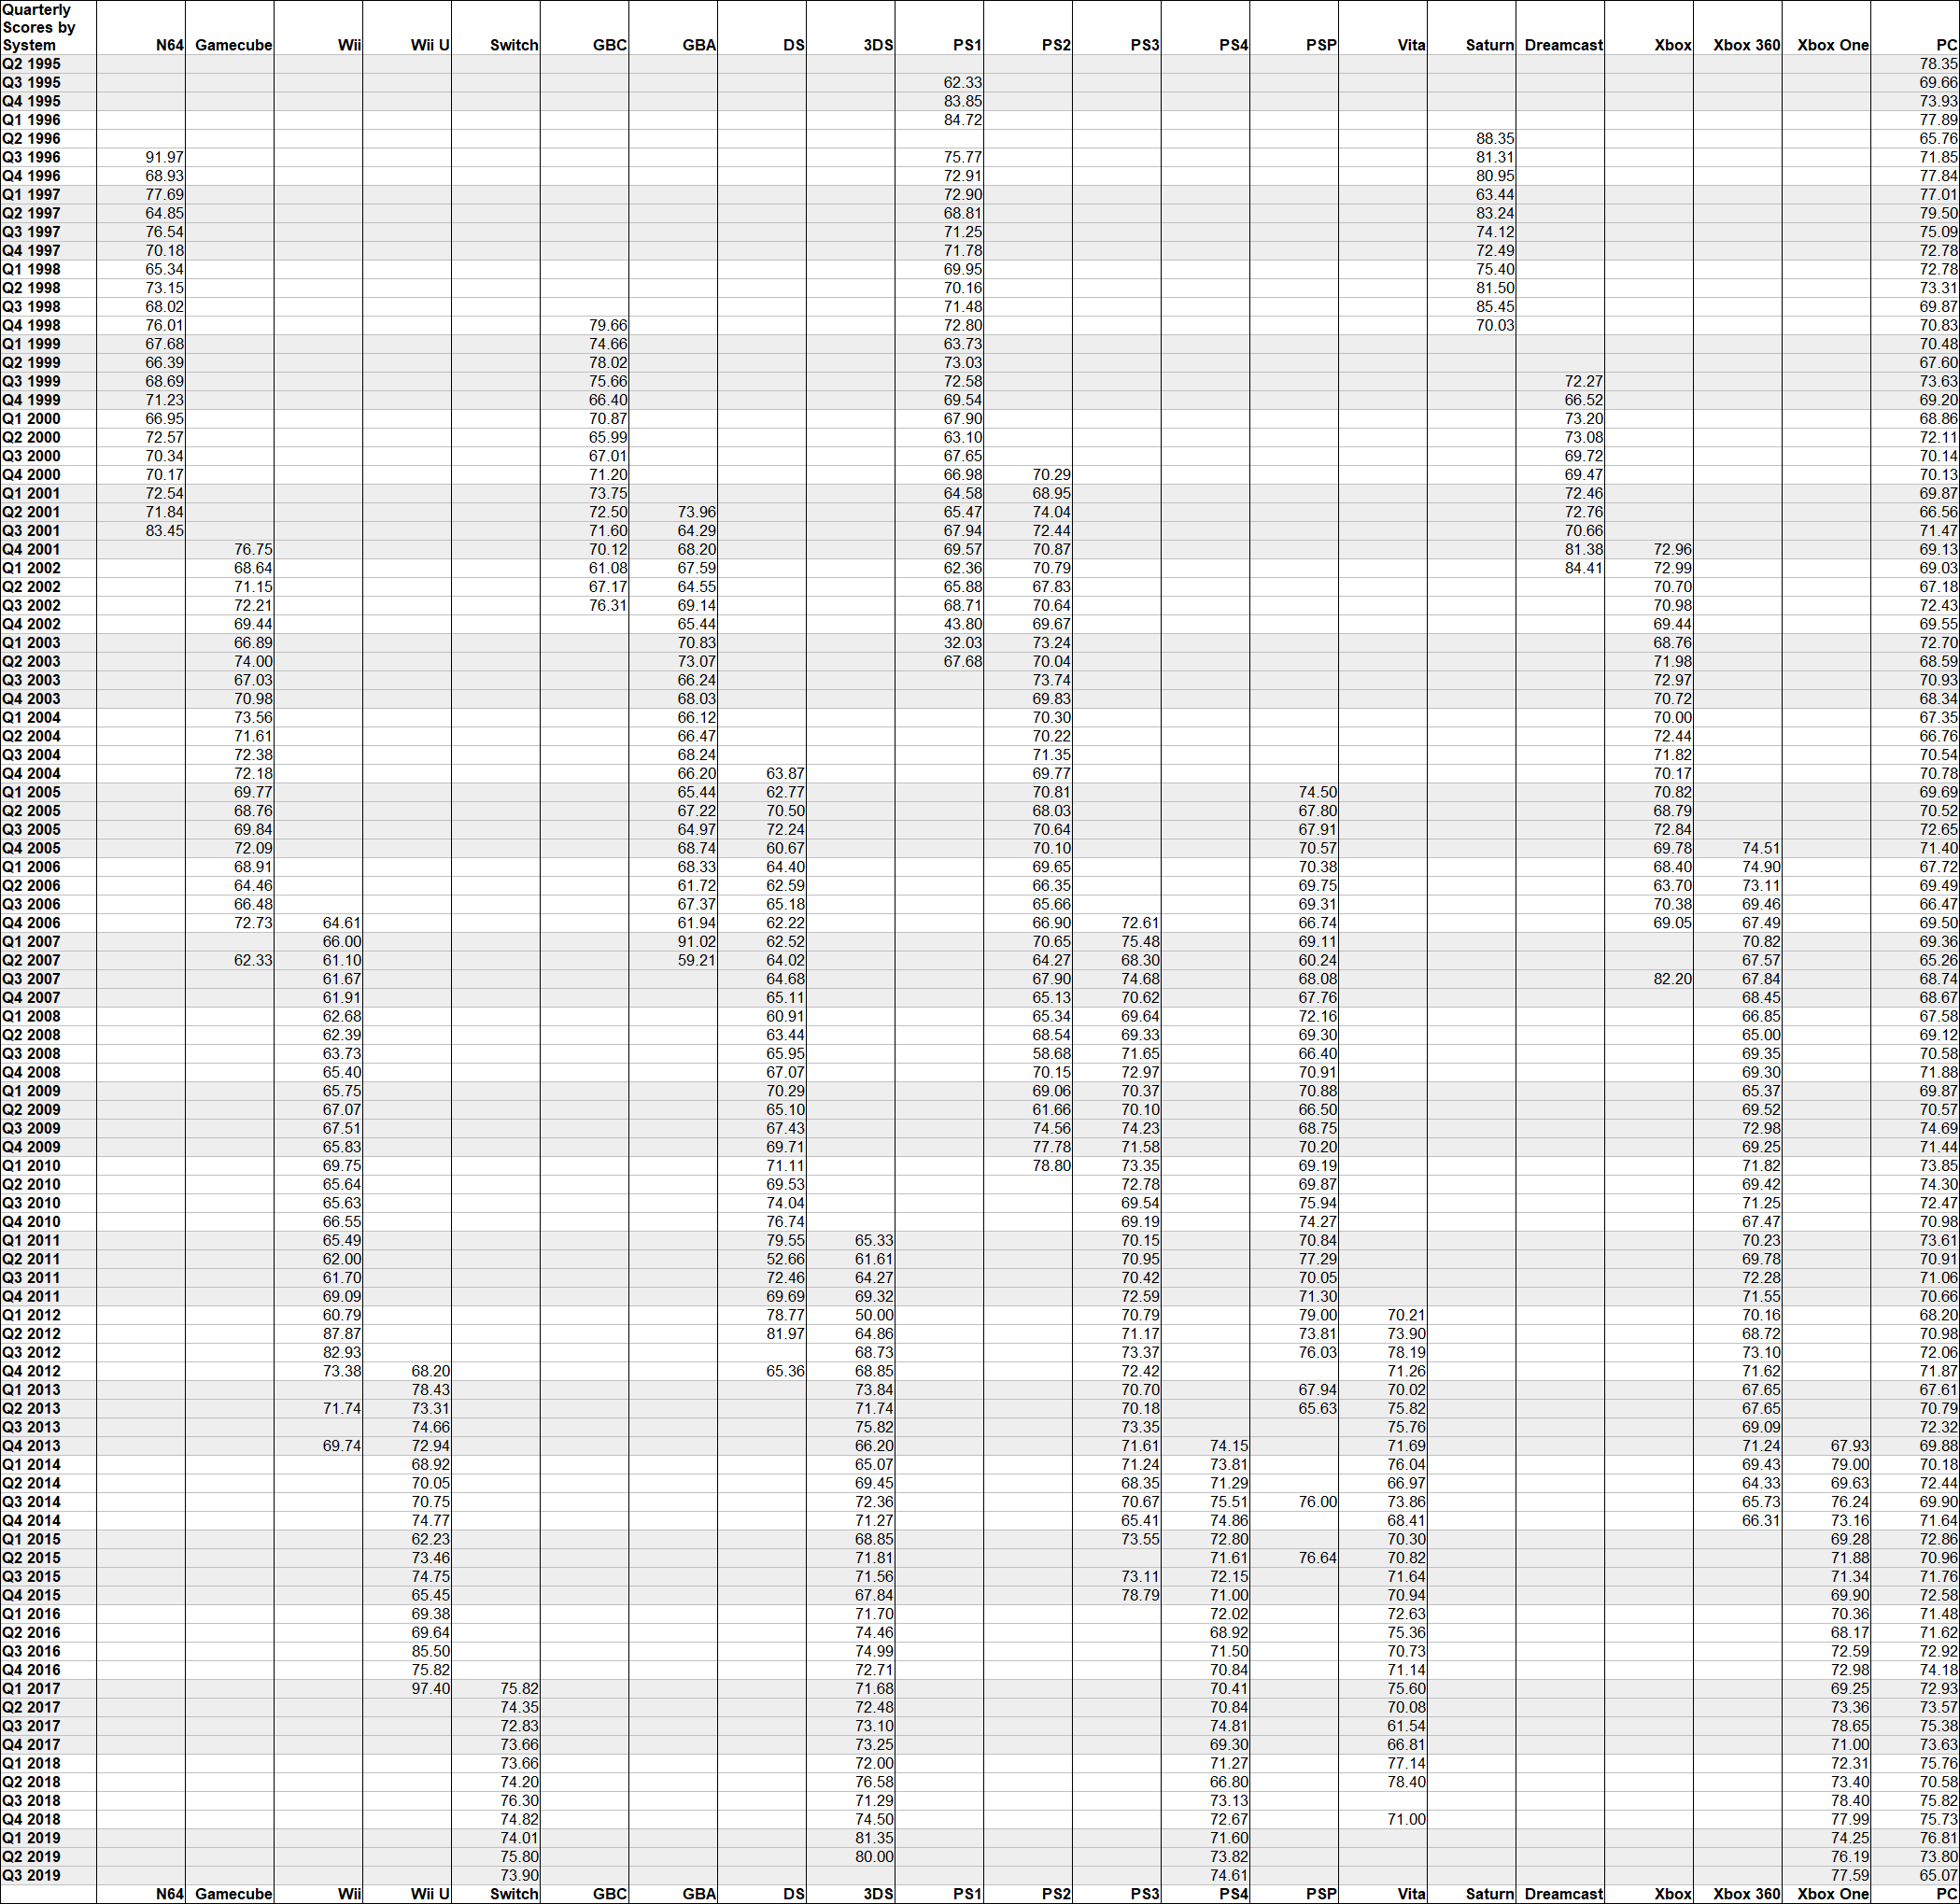
In case you don’t like all of those lines, here’s the full chart, with the PS1 correction. There were quite a few gaps late in the PSP’s life.
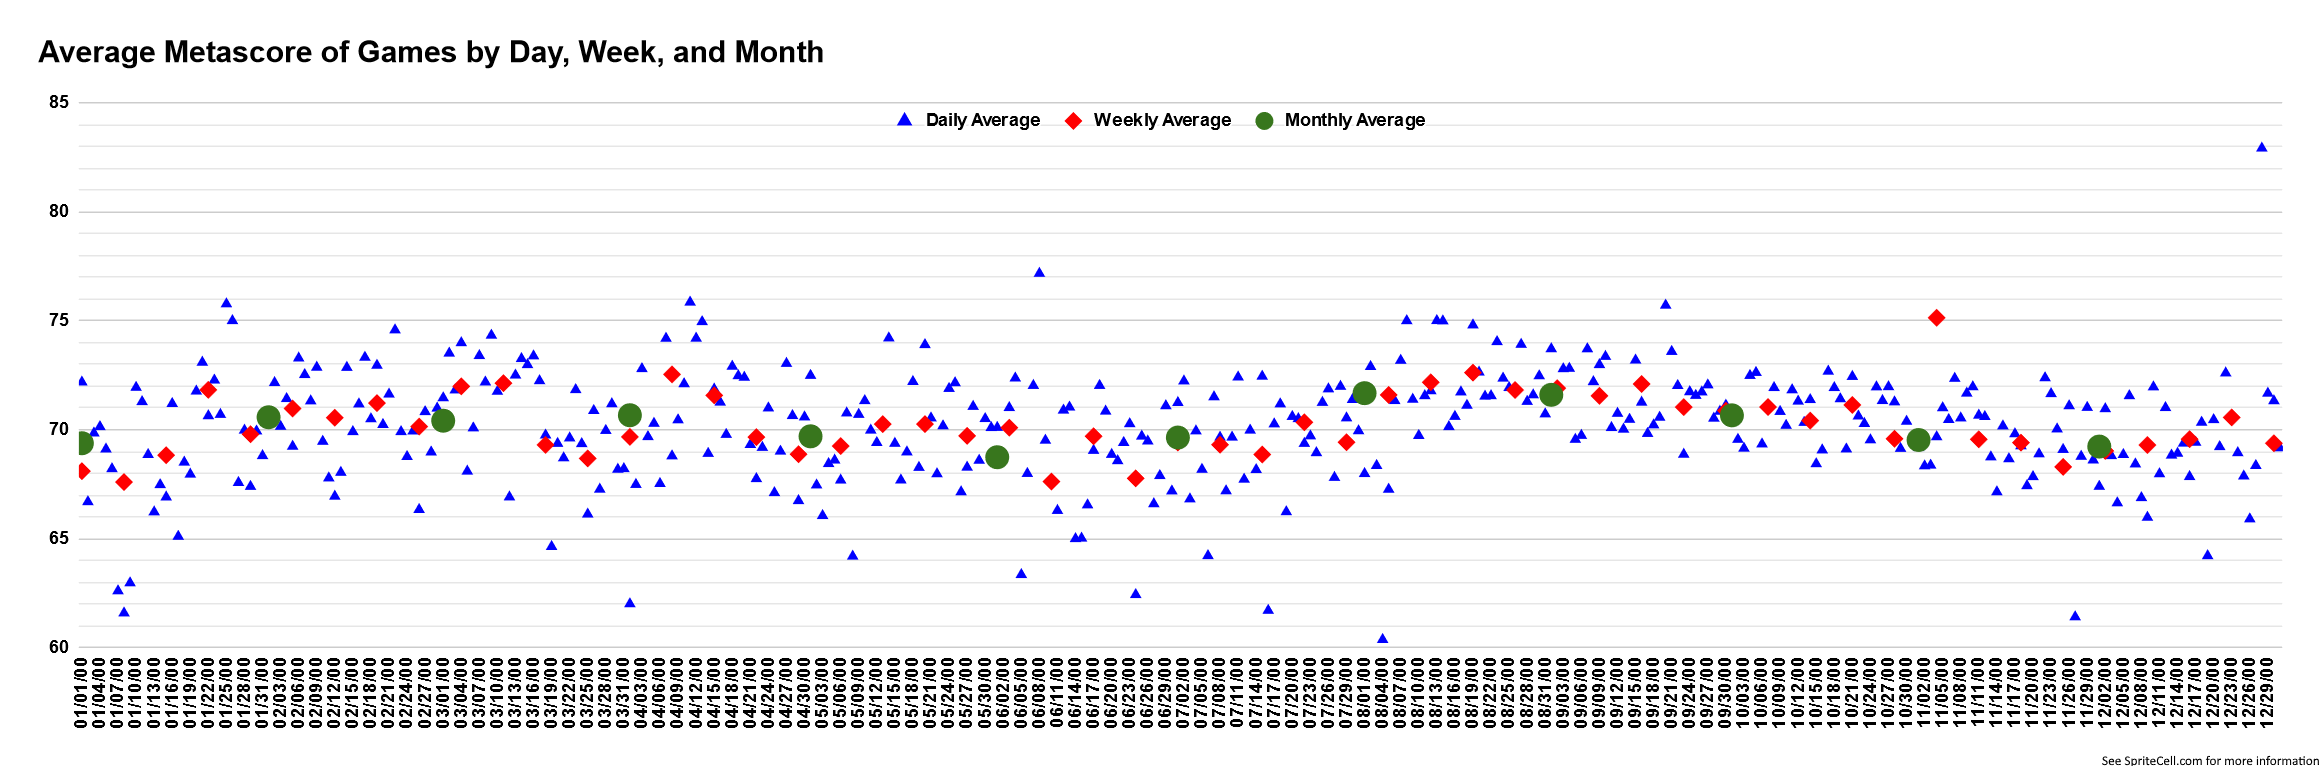
People often refer to a lack of games and a lack good games during the first part of the year. And during the summer. Here I took every game with a metascore and changed the release year to 2000 to find when the best and worst games are released throughout the year. Daily scores are all over the place, there’s not much to glean from them. 12/28 is the highest, but only 4 metascored games were released that day.
Weekly averages have more of a story to tell but still have some odd peaks and valleys. Monthly averages show a gradual rise and fall, but only vary by about 3 percent.

The raw numbers show August, September, and October as the critical highlight of the year, quickly followed by the December and January low points. Despite August’s strong performance, it has the weakest day of the whole year on the 4th. The highest rated months also seem to have daily values that are less variable.
Metascores – Specifics
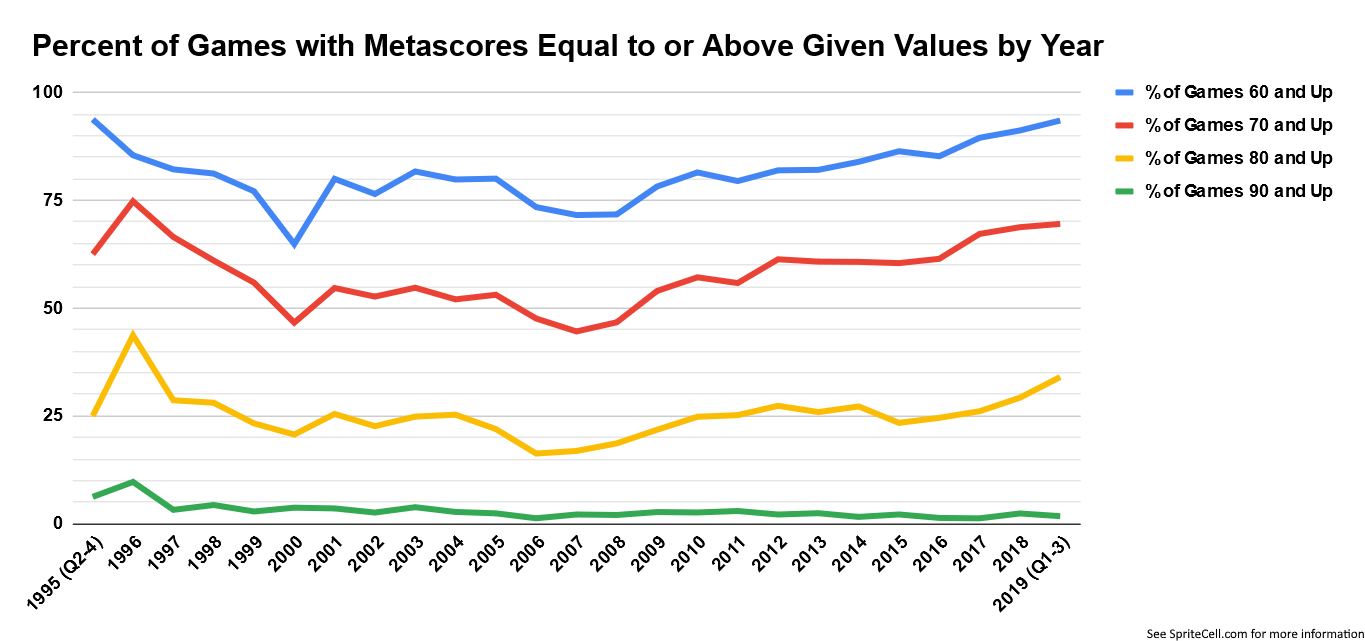
Sure, 70.25 might be the overall average metascore, but how are those distributed? While scores have crept up over the years, 90+s have consistently stayed under 5%. On the other end of the scale games scoring under 60% aren’t a whole lot more common.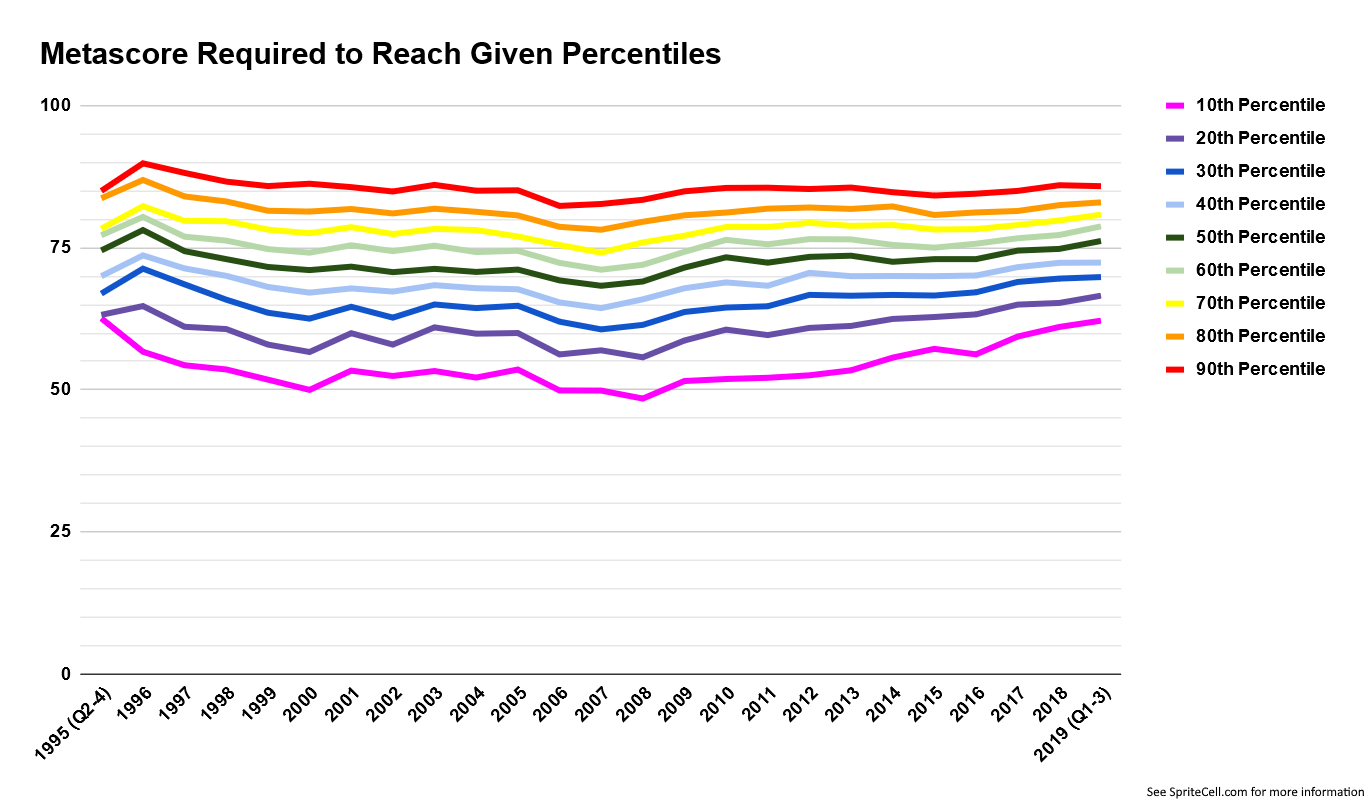
Percentiles are the value needed to be in the top x% percent(ile). So if you get a 95% on a test in a class of 100 students, and only one person scored better than you, you would be in the 99th percentile and the value of the 99th percentile is a score of 95. The 100th percentile is the highest score, and the 0th percentile is the lowest.
I should have reversed the order of the legend, oops. Just over an 85% metascore will put a game among the 10% highest rated. The gaps between percentiles get larger the lower you go, but overall they are pretty evenly spaced among their small range.
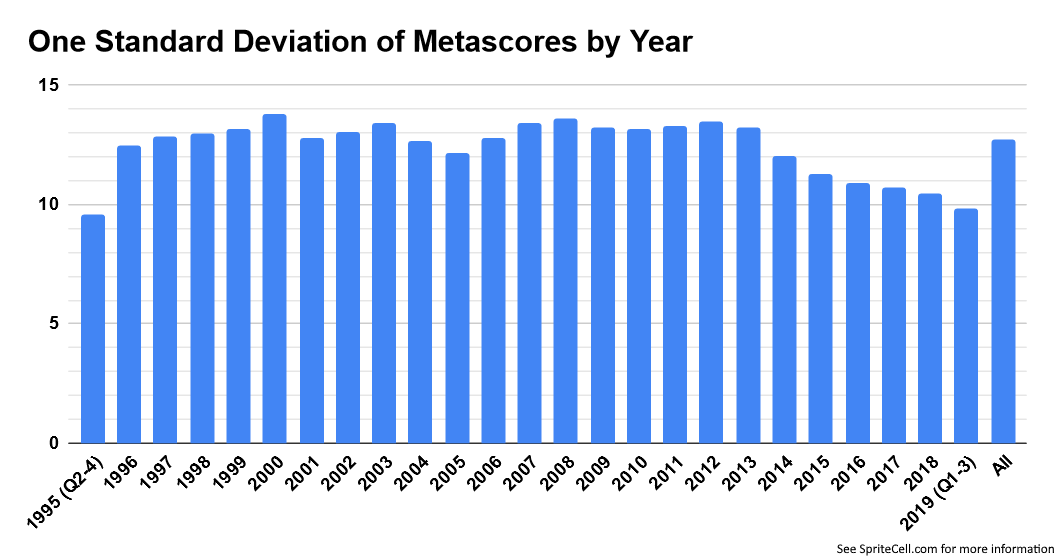
The standard deviation is a measure of how much values disperse (deviate) compared the average (standard). A low standard deviation means values are mostly close together, of which game metascores are an example, and they have become closer for several straight years.

You really like numbers if you look through this chart detailing the last three graphs.
Metascores – 90+
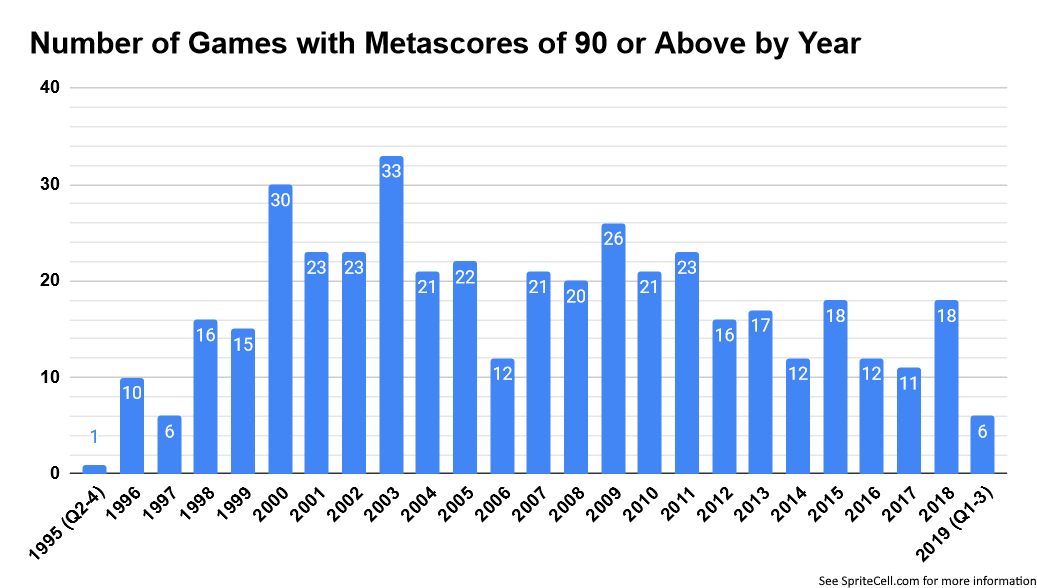
Games that score at least a 90 can be considered the very best games with cross-genre appeal that are part of the conversation about the best games of all time, classics that are discussed for many years. The number of 90+ games doesn’t follow average review scores too closely, although 2006 is still a bad year. Keep in mind I have few games from 1995-1997, I know a lot of great stuff came out then, this is not percent based at all. Even with average review scores creeping upward, the number of 90+ games has generally gone down. Do you think 2003 really had a classic coming out more than every other week on average?

Keep in mind that pre-1999 games were more likely to be included if they were the best and most famous games. 2006 is again a low point, but we can see 2011 being a turning point as well. My cutoff was before the likely highest scoring time of year for 2019, so it probably wouldn’t be as low as shown here if I included all of it.
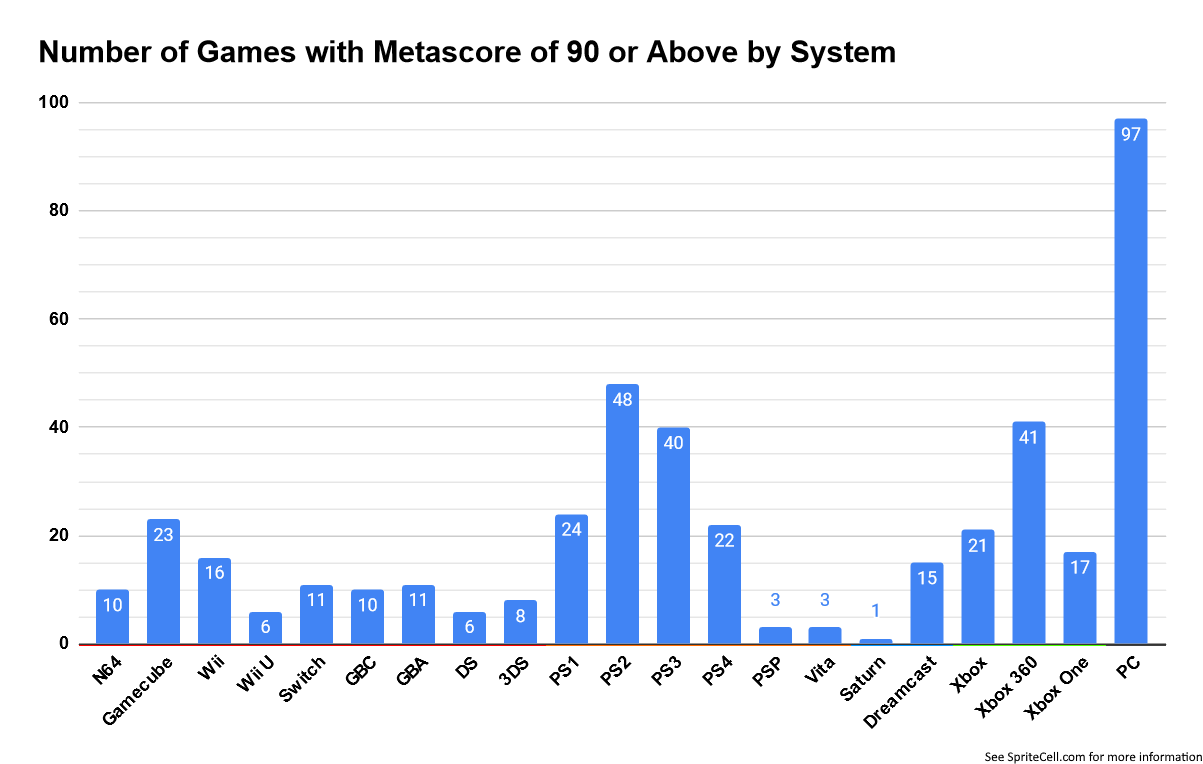
But enough about percentages, maybe you just want to buy the system with the most high quality games available. Well, you can’t go wrong the system that has been around the longest, the PC. But to put that into perspective, if we consider the average system’s lifespan to be 6 years, then the PC has been around for 4 and one sixth system lifespans (for the purposes of this 25 year study). If we divide that 97 by 4 and one sixth, we get an average of 23.28 per system lifespan, pretty close to the Gamecube. At 5 year lifespans, 19.4.
The massive libraries of the PS2, PS3, and Xbox 360 help them achieve top status if we disregard the PC. Other than the exceptionally successful PS2 the numbers remain pretty close between Sony and Microsoft when comparing competing consoles. The Dreamcast had quite a few in its short lifetime.
That’s all for this post, next up is genres.
Sources
GameRankings.com for metascores and some release dates. Archives: 1, 2, 3
MobyGames.com for genres, some release dates, some ESRB ratings, and some ESRB content descriptors
HowLongToBeat.com for main story and completionist times.
ESRB.org for ESRB ratings and ESRB content descriptors
Wikipedia for its many lists of games