This was originally posted on reddit. I probably won’t use data from VGChartz again, but I think it was a fine estimation for this kind of thing. I was surprised it got so little attention, although I’m not very happy with my writing looking back on it now.
A topic that often comes up is how important a series is to Nintendo, which series should get another game, which series are underappreciated, which get the best review scores, and which no one would miss. I wanted to approach this with numbers.
I gathered review score and sales data for 30 Nintendo series, and calculated attach rates. I thought it was important to consider both sales and attach rates because selling 3 million copies on the Wii is different than selling 3 million copies on the Wii U.
This only includes Nintendo published and owned series. Not all of these games are Nintendo developed, however.
I didn’t include some “casual” series, like Nintendogs, Brain Age, or the Wii series. I think Nintendo is done with these, and they targeted a different group than the “core” games we like to discuss.
Series had to have at least 3 games with full data available. Sorry, Kid Icarus, you didn’t quite make it. I wanted this to be more of a historical look at established series, but there’s some Splatoon numbers in the fun stats section.
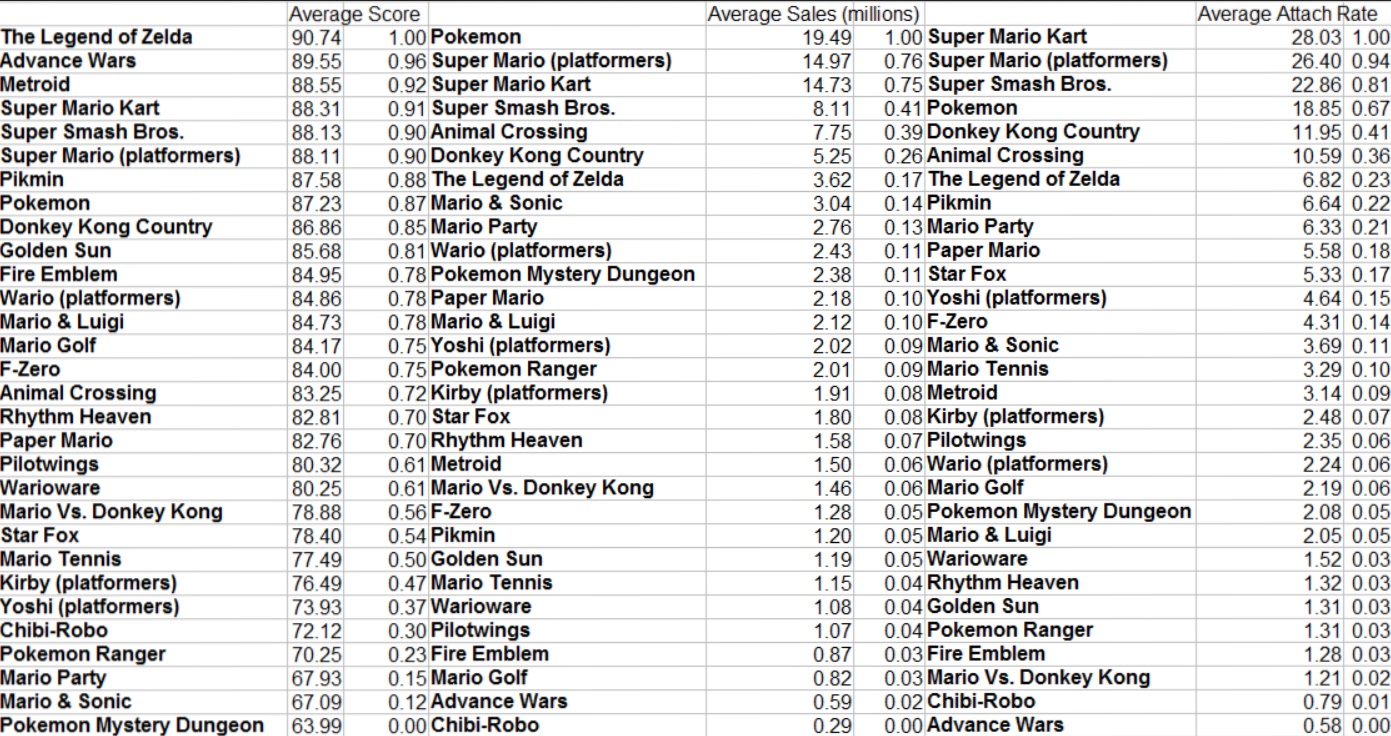
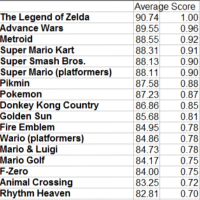
Here is the overview of average scores, sales, and attach rates. The columns on the right are normalized (scaled specifically to that list) numbers so that we can compare things more easily and for the next charts.
The top three in terms of scores don’t feature Mario at all. I knew Advance Wars was liked, but I did not realize they routinely reviewed that well. Donkey Kong Country also surprised me.
Pokemon dominates the sales numbers, although there are some caveats, which you can read about further down. If you consider dual versions as separate games, the average sales are only 9.1, which would still place it at third, and the attach rate would be 8.79, good for 6th place.
Sales and attach rates manage to stay pretty consistent, although some series with most/all of their entries on DS have much worse attach rates.
Here I add the normalized numbers to give a score based on review scores and sales/attach rate. I think this is an interesting way to look at things, it makes sense to not focus entirely on one or the other. Fire Emblem has seen a big resurgence in recent years and considered one of Nintendo’s big IPs now, yet it is only in the middle of the pack. Mario Party is also surprisingly low, but they really have been churning them out. Pokemon Mystery Dungeon’s large, vocal fanbase online has always mystified me, and here we see it on the bottom, due to its sales not making up for its scores.
Once again, I must mention Pokemon’s unique release structure and how it effects these standings. Scores have a somewhat disproportionate effect on this chart due to Pokemon’s dominance in sales when dual versions are counted as one game (that is how Nintendo does it). If you look at the first chart again you will see that the normalized numbers for sales plummet to .76 for second place, a much bigger drop than scores.
Here we see which series have a disconnect for sales versus scores, you could say they aren’t selling up to their potential or that they are hidden gems. Advance Wars takes first with its second highest scores and the second lowest sales, none of the four games have sold over a million copies. Mario Golf isn’t a something you hear a lot of demand for, but it’s pretty high up here. Pokemon’s huge sales numbers can’t make up for its merely “great” review scores.
Some fun stats
-
The highest scored game: Super Mario Galaxy with 97.64
-
Lowest scored game: Mario Party: The Top 100 with 53.2
-
Best selling game: Super Mario Bros. with 40,240,000
-
Worst selling game: Maybe Warioware Gold (still pretty new and very speculative number) , maybe Chibi-Robo Park Patrol (Wal-Mart exclusive, not even released in EU)
-
Highest attach rate: Super Mario Bros. with 65%
-
Lowest attach rate: If you don’t want to count Warioware Gold, Advance Wars: Dual Strike with .25%
-
Splatoon sold 4.93 million copies on Wii U (Splatoon 2 is at 6.76 currently). If allowed on the list it would have been 7th on the best selling chart, above The Legend of Zelda’s average. A 36.36% (Splatoon 2 at 34% currently) attach rate would be 1st overall, well above Mario Kart.
-
Average review scores for each system among the games included (this is more for fun, we don’t have a representative sample of games to really consider this a look at which systems had the best games): SNES 87.68, N64 84.02, Gameboy/Color 84.29, Gamecube 83.85, Gameboy Advance 83.5, Wii 81.84, DS 79.18, 3DS 76.73, Wii U 76.66. Interesting that they tend to go down over time.
-
The correlation between review scores and sales was r = 0.3296. Not very strong.
-
203 games were used for this study
About the score, sales, and attach data
Nintendo almost always releases sales numbers for games that sell over 1 million copies in their financial reports. These are used on Wikipedia to make lists like https://en.wikipedia.org/wiki/List_of_best-selling_Nintendo_3DS_video_games I used these lists for the bulk of the sales data. Most of these games sold over 1 million copies. Please keep in mind these often-quoted numbers are still not exact. Games can sell more after these reports come out, and Nintendo isn’t going to include a game in their reports forever. For games that sell less than one million, I have to go with the best estimates that exist, which is usually VGChartz. The errors on these numbers are certainly higher than Nintendo’s numbers, but it’s the best we have. None of them seemed particularly unlikely to me, but keep in mind that lower-selling games are more likely to be more wrong. Sometimes I was able to find supposed leaked sales estimates from NPD and I used these when possible.
I used GameRankings instead of Metacritic for average review scores mostly because it goes back farther and they are given to two decimal places. Unfortunately, it does not have NES scores. Attach rate is the percent of copies that exist relative to the hardware. If a game sells 1 million copies on a system that has sold 100 million, it has a 1% attach rate.
About the games I looked at
For each series I only included “mainline” games. When it doubt I referred to wikipedia or series-specific wikis to draw these lines. I’m sure people will disagree with some of the inclusions and exclusions, but in the context of talking about “which series does the best/deserves a new game”, it doesn’t make sense to consider Kirby’s Dream Course to be the same series as Kirby Super Star or Kirby’s Avalance, games which all play very differently. There aren’t always clear lines, and some series like Yoshi platformers are all over the place, so here are some examples: Star Fox Adventures: doesn’t count. Kirby’s Epic Yarn: doesn’t count. Super Mario Maker: doesn’t count. Donkey Kong Land trilogy: doesn’t count. Yoshi Touch and Go: counts. Tri Force Heroes: counts.
No ports or remakes, I wanted this to focus on games that were brand new when they released and free of “oh yeah, I remember liking this game” or “this game feels dated” reviews. I did, however, include pretty-much-identical ports to other systems if they happened within a year, such as Smash 4 and Twilight Princess. This ended up being beneficial to Pokemon since games like Platinum and Omega Ruby get lower scores and have lower sales.
Speaking of Pokemon, it was difficult deciding how to approach it. You have dual releases that are almost identical and have their sales numbers added together. Review sites generally review them as one game, though there are exceptions, every game has slightly different scores. However, a pretty large but unknowable percentage of people buy both versions, essentially two copies of the same game, which means sales data gives a skewed look at how popular Pokemon is. I’m sure there are also people who just wait for the “definitive version(s)” released one or two years later, while others (like me) will buy almost the same game a third time. Yellow, Crystal, Emerald, and Platinum are also much more similar to their base games than Black2/White2 and Ultra Sun/Moon were so you’d have to consider counting the latter if not the former. The remakes are also much bigger deals than other video game remakes usually are. In the end, I decided to count dual versions as one game (so 7 games, one for each generation), and average their scores. No third/fourth versions or remakes included. This gave Pokemon a big boost.
Fire Emblem Birthright and Conquest are reported with their sales numbers combined even though they are definitely more different than Pokemon versions and have more greatly differing review scores. In my spreadsheet I gave them each 50% of the sales.
I did not include download-only games. These games tend to be much lower profile, never seem to have sales data, and have much fewer reviews if any.
No Switch games. Sales and attach rates still have a lot of time to change. There were also no Virtual Boy games included, there’s no sales data or review aggregates.