“Nintendo Games Never Go On Sale”
I’ve long wondered just how true the adage “Nintendo games never go on sale” really is. The consensus seems to be that Nintendo has fewer sales with smaller discounts than their competition and that this holds for both digital and physical versions. There are also many discussions about whether you can find better deals buying physical or digital versions of games, not just in regards to Nintendo. I wanted to find out the truth and answer these questions with numbers to really see how Nintendo’s prices compare to everyone else while also learning more about how video game prices and discounts vary across publishers and the platforms they are sold on.
The Gathered Data
To find all this out I recorded price data for 900 non-free games on the Nintendo Switch, PlayStation 4, Xbox One, and PC. I chose these because I wanted to focus on a specific time period and games that competed with each other, as well as being a bit more “settled” than the Switch 2, but still being actively bought. To select the games I started with games published by Nintendo, Sony, and Microsoft. Then, I added games with the highest metascores. Then, I added games from publishers that didn’t have quite enough of a sample size to be compared against each other. Finally, I added random games that seemed noteworthy, focusing on indie games. There are no PC-exclusive games other than Half-Life: Alyx. Almost all PC game prices are for the Steam platform, but a couple Blizzard games that are on Battle.net but not Steam are included. All games were at least one year old as of January 1, 2026. The oldest game was Bastion’s PC release, August 16, 2011 and the newest was Dragon Quest III HD-2D Remake for Switch, released November 14, 2024.
There were initially 1,025 games included in the study. As I went through collecting pricing data I had to delete a lot of games because they had been delisted from digital stores. This included many sports and racing games, games with a mobile app component, and games with an integral online component that had been taken offline.
For physical release data I recorded the January 2026, 2025, 2024, and 2023 values according to PriceCharting and averaged them. The data is all for “CIB” quality, meaning these games are complete but not new, they have had the plastic wrap removed and have probably been played before and are sold by individuals and used game stores on eBay.
Digital price data is from SteamDB, PSprices, and IsThereAnyDeal and covers the span of January 1, 2023 to December 31, 2025. The start date, end date, and sale price were recorded for every digital sale during this three year period. This cuts short the duration of some sales that started in late 2022 or ended in early 2026. All of this data is from official storefronts, not third party key sellers. Some sales were a bit more complicated, dropping in price and then dropping more or increasing in price without going back to the base price. I didn’t have a good way to record these fluctuations so I counted these as a single sale and only the initial sale price was recorded. Special discounts only offered to PS Plus or Game Pass members were ignored. The base price as of January 1, 2023 is the base price recorded, even if it drops some time during the three year period or was originally higher.
The most “basic” physical and digital version of each game was used for data, so no collector’s editions or later releases with DLC included, unless it was the only version being sold digitally. Thus the physical and digital price data for a game could be based on slightly different versions.
Many games did not have a physical release, though only three were not released digitally. These were all Nintendo games that require physical objects to play: Ring Fit Adventure, Nintendo Labo Toy-Con 01: Variety Kit, and Mario Kart Live: Home Circuit.
I discovered a few games had been included twice in the data very late into this project. This gives them undue weight and I apologize for the errors.
A little quirk of English is that “on sale” can mean both “has been temporarily reduced in price” and “is available for purchase”. I am exclusively using the reduced in price meaning when I say “on sale”. “Sale price” refers to a discounted price while “base price” refers to the price when there is no discount. All prices are in U.S. dollars and all data was gathered from U.S. storefronts.
Overall Game Pricing
For the overall data I’ve mostly used frequency graphs, showing how many of something there is within a range, while the publisher, platform, and indie sections use averages. Graphs showing the same thing in each section use the same colors, for example all graphs about the number of sales per year are light blue.

To start off, just how often can you expect a digital game to go on sale in a typical year? For more than half of the games studied it’s between 4 and 8, while it’s rare for a game to have more than 10 sales in a year.
The three games that went on sale most often were all PC releases: Neva (12.39 times a year), Thief Simulator (12.99 times a year), and Scarlet Nexus (13.99 times a year). Scarlet Nexus was a constant reference point in my spreadsheet, as it was the only game with a recorded 40th, 41st, or 42nd sale during the three year window.
A small number of games didn’t go on sale once during the three year period and I’ll talk more about them in another section.

The most common amount of time a game is on sale digitally is 15 days, or two weeks, representing almost 24% of all sales. You may be thinking “two weeks is actually 14 days”, but both the start and end date count. There are sales that began and ended on the same day, it makes more sense to count them as 1 day long than 0 days long.
I have Call of Duty: Modern Warfare III – Cross-Gen Bundle for the PlayStation 4 as the longest sale at 120 days, but I suspect this is an artifact of what exactly is being sold under that store ID changing at some point causing the data to not be recorded correctly, as the sale price starts before the listed launch date. This hopefully corresponds to an actual sale of some game.
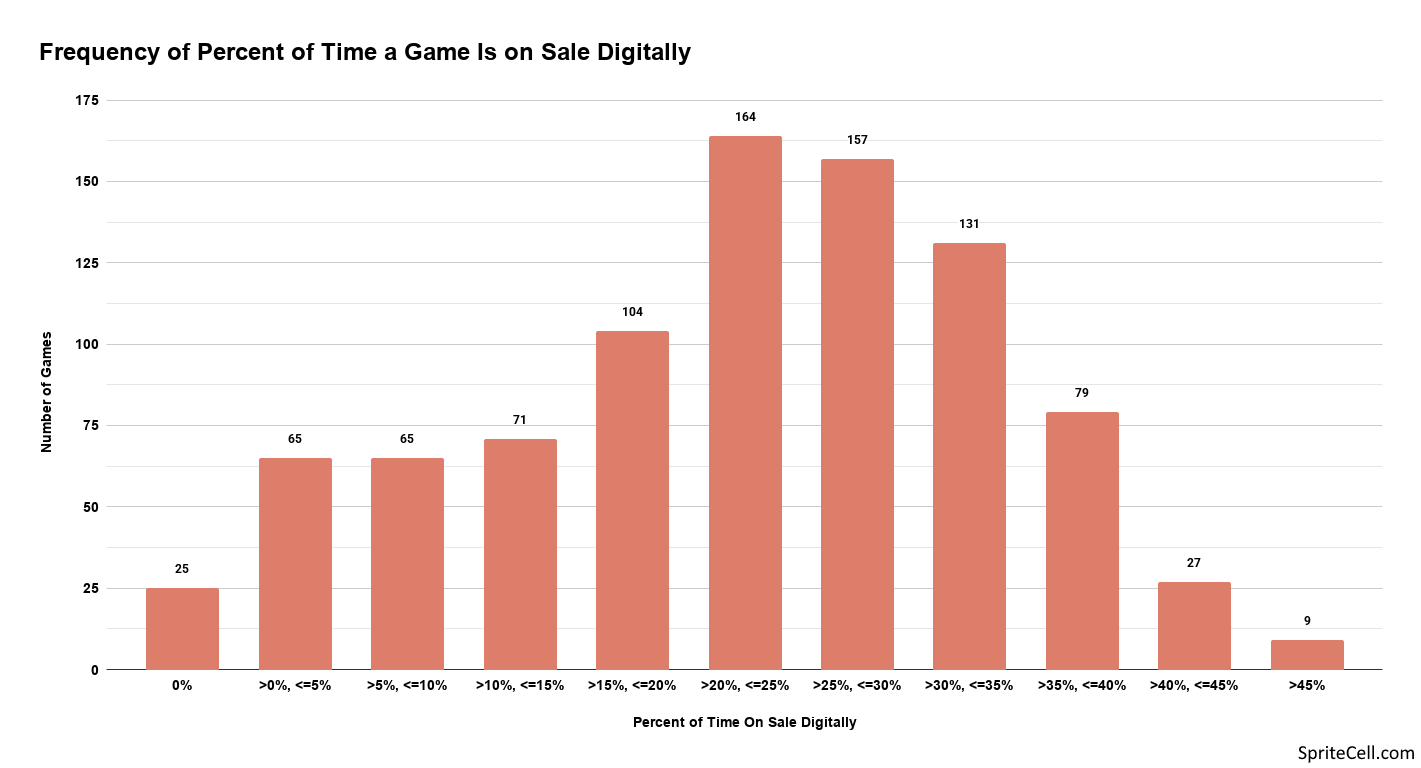
Combining how often a game is on sale and how long it is on sale for, here is the total percent of time a game is on sale. I was surprised to see a majority of games being on sale at least 20% of the time. I have to wonder how many people are actually buying games at full cost when they have so many opportunities to buy them at a discount. Publishers rely on sales to grab people’s attention rather than lowering the base price.
Four games were on sale over half of the time: Marvel’s Midnight Suns for PC (54.56%), Tiny Tina’s Wonderlands for PC (52.37%), Thief Simulator for PC (52.19%), and NBA 2K25 for PC (50.73%).

This graph shows to what percent of the original price those discounts bring the price down to. Please note that this is not the size of the discount, it’s the opposite.
50% of the original price is the single most common, but 25% is close behind. The majority of sales include these values or are in between them.
The only games that were available for free for a period of time were chapters of Dontnod’s adventure game Tell Me Why.
I don’t know what the deal is with some of the tiny discounts, but these games often dropped in price further without going back to the base price. It looks like price tracking websites may have incorrectly recorded the size of some sales and then registered the correct sale price a few days later.

One of things I really wanted to test was how physical prices compare to digital. Three digital prices are here for comparison: the cheapest a game ever was during a sale, the average of all sale prices, and the price when not on sale. 546 games had a physical version and 897 had a digital version. About 46% of physical games can be had for under $20.00.
There’s a whole lot of games that are discounted down to under $10 digitally, but it’s harder to find a physical game for that price.
The cheapest price of a digital game that wasn’t given away for free was Halo: Spartan Assault on PC, discounted down to $0.74.
Secondhand physical games have the disadvantage of having no price cap, and a handful of games are sought after enough to command prices of over $70. Shantae and the Pirate’s Curse for the Switch had a limited print run and a CIB copy now goes for over $300.

Rather than counting the number of games available for various price brackets, this graph shows how often physical beats the various digital categories.
Don’t let anyone tell you that digital is always cheaper, a quarter of games can be bought physically for less than when they were at their steepest discount and physical is consistently cheaper than digital games not on sale.
Game Pricing By Publisher
I decided 10 was a good enough sample size and thus 16 publishers were chosen to compare against each other. I initially thought I would be able to include Valve as a quasi “PC first party”, but the number of non-free games that they’ve released in the last dozen years is actually quite small.
These are all as the publisher is listed for the game, ignoring who owns them, so Activision is included separately from Xbox Games Studios, and Nippon Ichi and NIS America are separate. Collectively these publishers comprise 80% of the games included in the study.
| Publisher | 2k | Activision Publishing | Annapurna Interactive | Bandai Namco Entertainment | Capcom | Devolver Digital | Electronic Arts | Konami | Nintendo | Nippon Ichi Software | NIS America | Sega | Sony Interactive Entertainment | Square Enix | Ubisoft Entertainment |
Xbox Game Studios
|
| Number of Games | 23 | 30 | 31 | 78 | 37 | 46 | 33 | 22 | 85 | 14 | 17 | 55 | 51 | 82 | 38 | 78 |

2k and Capcom come out on top for average number of sales per year and Xbox Game Studios easily has the most among the hardware makers.
The biggest standout here is Nintendo, whose games average less than one sale a year. In fact, 16 of the 25 games that were never observed to have gone on sale were published by Nintendo. This is especially common with Pokémon games.

This is the only graph whose y-axis doesn’t start at 0, this was done so the differences are a bit easier to see. There’s not a lot of variation overall, with the total range between longest and shortest sales being less than three days.
While Sony has fewer than average sales they do last longer than Nintendo’s or Xbox’s. The two indie publishers, Annapurna and Devolver, keep their sales short. I’ve never heard it said that Capcom has long sales, but it seems to be the case.

Those couple extra days translate into Capcom having their games on sale the most overall. The sports giants Electronic Arts and 2k aren’t far behind.
If you miss a Nintendo sale you’ll have a long wait until your next opportunity. Sony’s games are on sale the second least amount of time, but Xbox’s are above the overall average.

Ubisoft has a reputation for deeply discounting their games soon after release and it seems to bear out in the data, but the major sports publishers 2k and Electronic Arts have deep discounts too.
Nintendo’s sales are rare and when they happen they’re usually 30% off, a much smaller discount than anyone else. Sony’s published games are again a distant second while Xbox’s games get bigger discounts than the overall average.

They may not go on sale often but a game published by Nintendo is almost certainly getting a physical version. Sony is well above the average, while fewer than average of Xbox’s games see a physical version.
There are some considerations publishers have to make when deciding if a game is going to be released physically. Manufacturing and shipping costs as well as a retail store’s cut create a price floor. Customers are less likely to buy a physical game if the digital version is significantly cheaper, making smaller scope and cheaper games skip a physical release. Annapurna and Devolver publish a lot of indie games that cost less than $30, making a physical version difficult to justify.

When smaller games do get physical releases they are often only because of limited print run and boutique manufacturers. Only being available to purchase new for a limited time means that some will miss out and secondhand copies can cost quite a bit, as we can see with Annapurna and Devolver here.
Nintendo’s physical games tend to be cheaper than their best digital sales, even though their physical games are a good bit more expensive than average. Activision and Nintendo were the only publishers whose games are cheaper physically on average.
Game Pricing By Platform
I’ve broken systems down into seven categories to look at how prices differ among them and how hardware manufacturers price their games compared to everyone else on their platform. “First party” here means it was published by the same company that makes the hardware and runs the digital storefront and “third party” is everyone else.
Microsoft owns Activision, Blizzard, Bethesda, and Mojang, so games published by them on Xbox One are first party.
The Switch first party category is the same as Nintendo-the-publisher, since Nintendo does not publish games for these other platforms. Sony and Microsoft publish some games on other platforms so their first party output is different than their publisher output.
| Platform | PC |
PlayStation 4 1st Party |
PlayStation 4 3rd Party |
Xbox One
1st Party |
Xbox One 3rd Party |
Switch
1st Party |
Switch
3rd Party |
| Number of Games | 245 | 39 | 199 | 46 | 135 | 85 | 151 |

Most of the games in this study were released on at least two of the four platforms and you might think sales would be handled the same across systems, but that isn’t the case. First parties having different sale strategies on their home hardware is not surprising, but why do third parties run fewer sales on Xbox One than PlayStation 4 or Switch? Could sales be slow enough on Xbox One that it’s not worth the trouble?
When publishers release their games on PC they put them on sale more often than they do for their console versions.
One thing I definitely noticed while gathering data was that publishers don’t start a sale for a game on multiple platforms at the same time, but also don’t seem to be concerned with making sure that sales don’t have any overlap across platforms.
There are rules for publishers about how often a game can go on sale, how much it can be discounted for, and more. Some of these may be more flexible if you’re a big player bringing in a lot of money. There’s little public information about these regulations other than Steam’s, and looking through those rules I definitely have examples of games that don’t adhere to them.

There is again not that much variation with sale duration. PC has the most sales, but also the shortest.

This is quite similar to the average number of sales per year.
I have no explanation as to why Xbox One’s first party games are more aggressive with sales than third parties, but it’s the opposite for Switch and PlayStation 4.
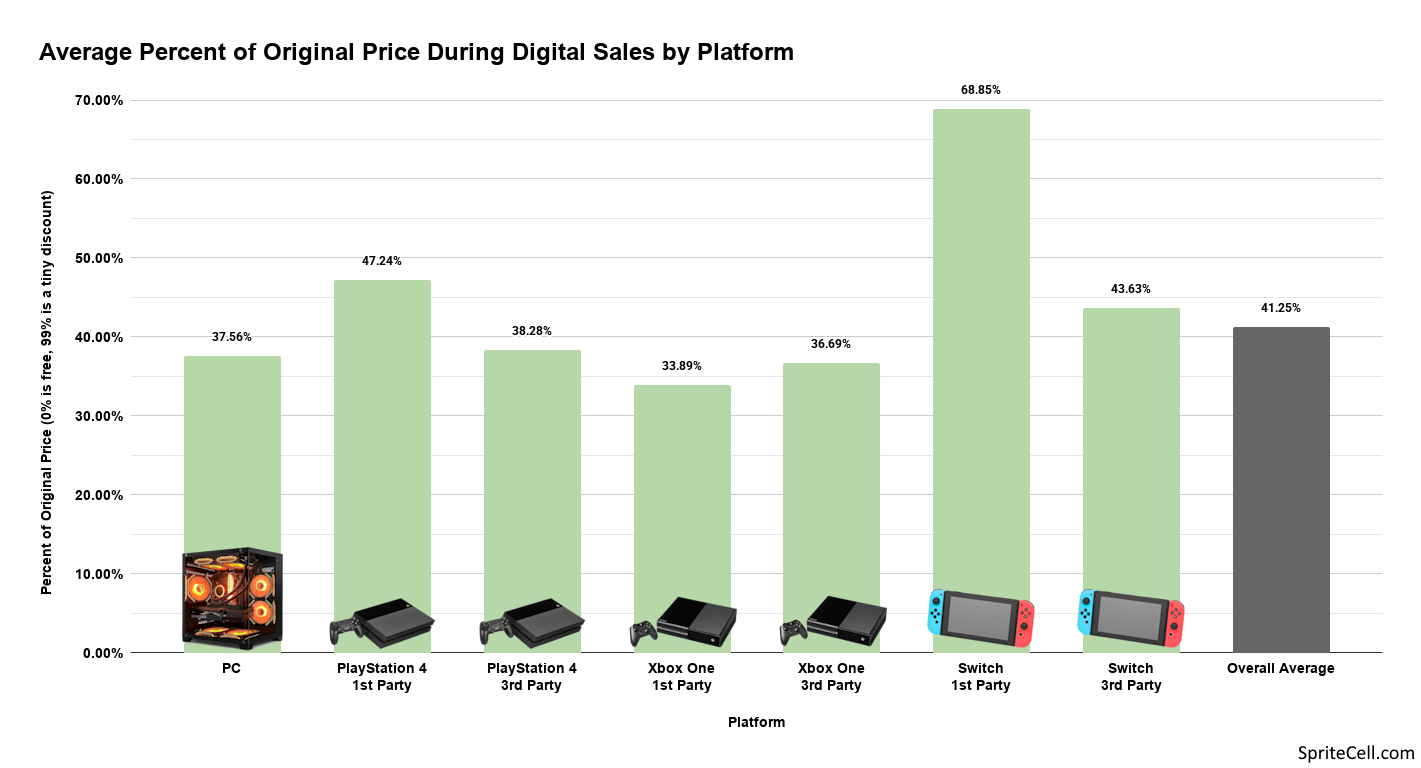
Xbox in general has the deepest discounts, and first party once again outdoes third parties.
Third parties lower their prices the least on the Switch.
It’s important to remember that this is only based on a sample that mostly consists of the best selling and highest rated games, because the majority of games for all of these platforms are digital-only.
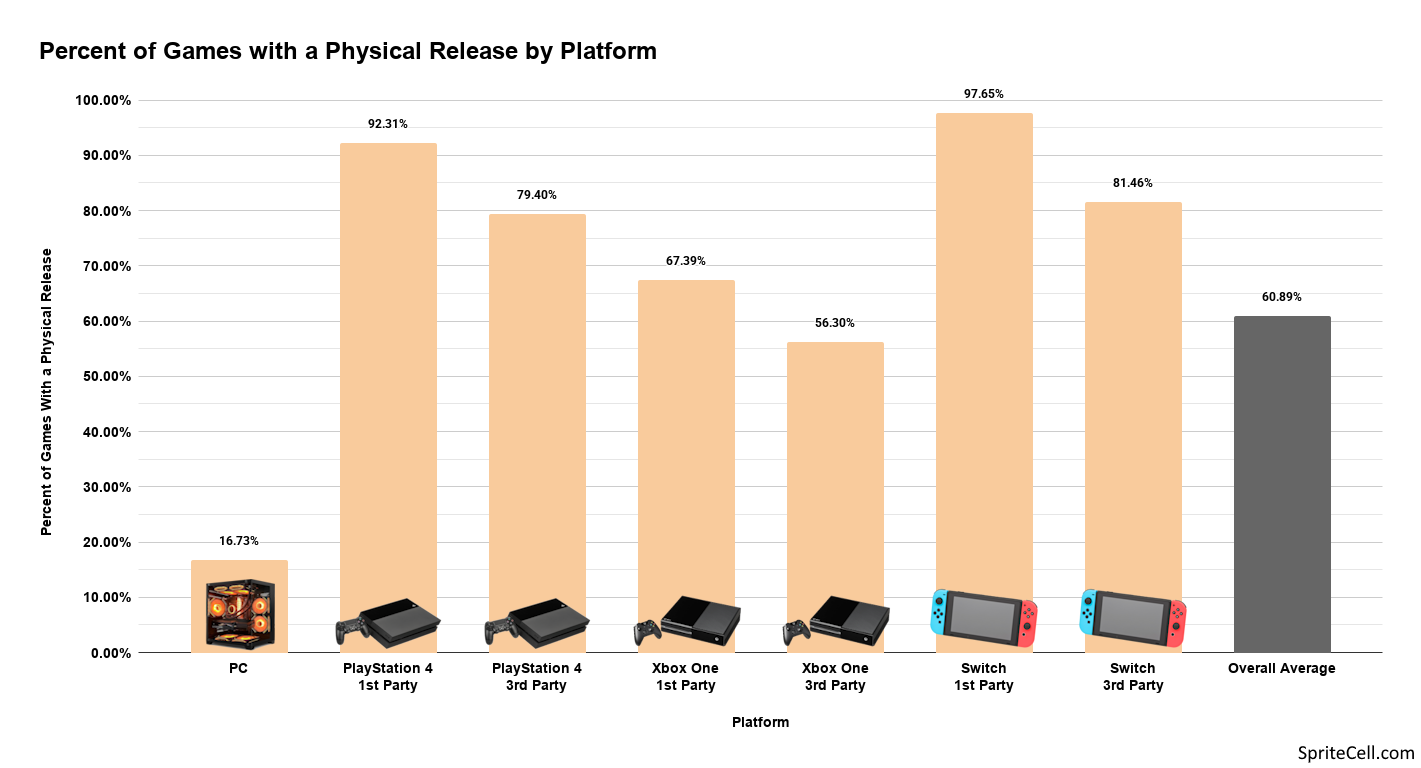
I was curious about physical Switch games since Game Cards are more expensive to manufacture than optical discs. Part of the strong showing from third parties is definitely from limited print run companies, which focus on Switch and cater to an enthusiastic collecting community.
PlayStation 4 first party isn’t far behind Switch first party, but physical media for Xbox One is lacking.
I was surprised at how many PC games got a physical release too, but quite a few are special editions that come with extra merchandise and have so few secondhand sales online that they couldn’t be used for average prices.
Physical Xbox games have always been cheaper than others, there’s just not a collector’s market like there is for the competition.
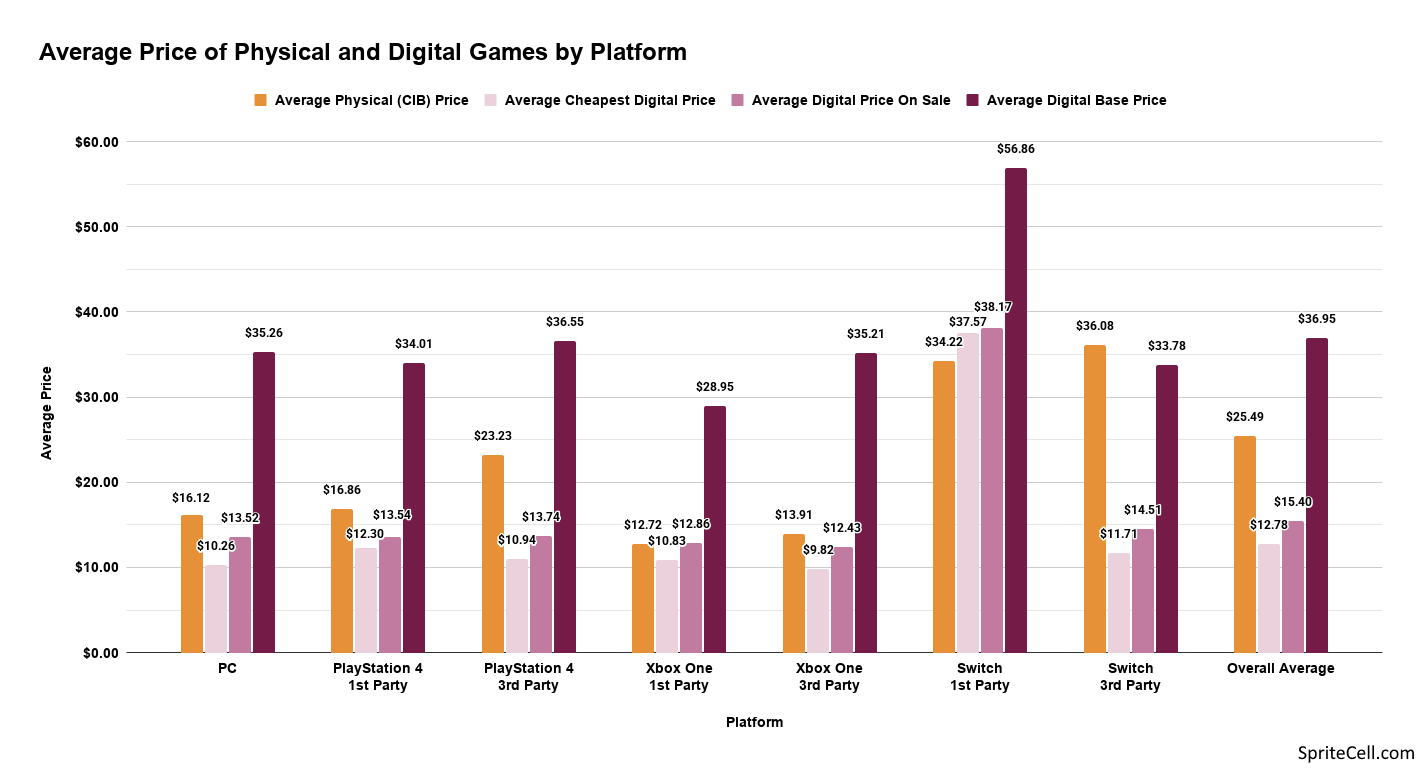
I did not expect physical third party Switch games to edge out first party, but again that is likely due to limited print run releases. I imagine publishers are also more leery of overproducing with Switch physical because of how much more expensive Game Cards are to make. Digital is a completely different story where third party games are about half the price of Nintendo’s games.
Digital prices are pretty similar outside of Nintendo first party. Xbox One first party has the lowest digital base price.
Game Pricing By Indie Status
There’s no perfect definition of “indie game”. I have labeled everything Devolver and Annapurna published as indie, and nothing from the 14 other publishers. Among the the remaining games I excluded any publishers that were owned by a larger company, like Digital Eclipse being owned by Atari, and then looked at individual games and made a decision that made sense to me. In total there were 207 total indie games. Devolver and Annapurna published most of these, so they have an outsized impact.
For some specifics we have the likes of Balatro, Cocoon, Hollow Knight, Among Us, Undertale, Hades, Dead Cells, Baba Is You, Enter and Exit the Gungeon, Undertale, and Stardew Valley.
Most of these indie games end up being pretty similar to non-indie games, and we’re only comparing two things so this section will be pretty breezy.
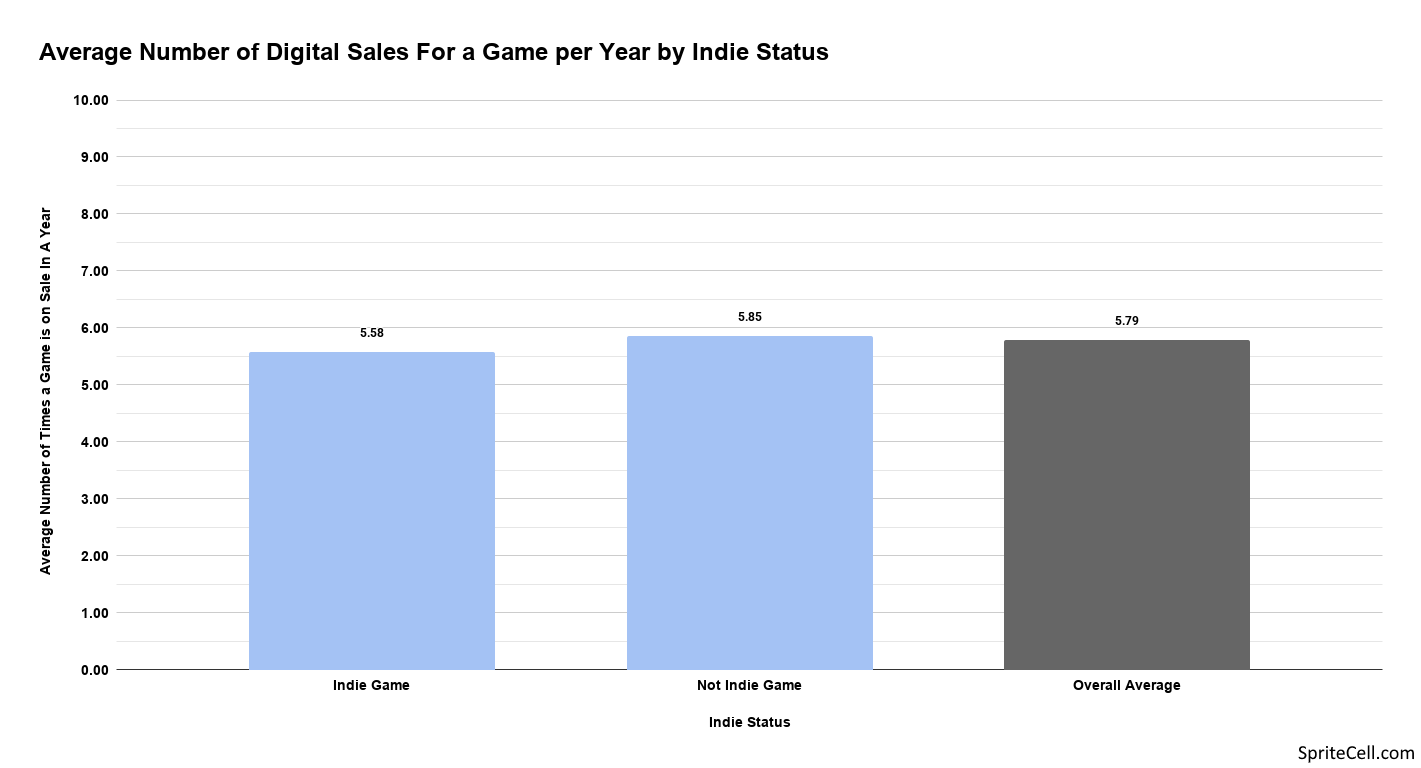
Indie games go on sale about the same number of times a year as non-indies.

This stat doesn’t vary much so this is actually a fair amount of difference. I’m not sure why indies would have shorter sales.
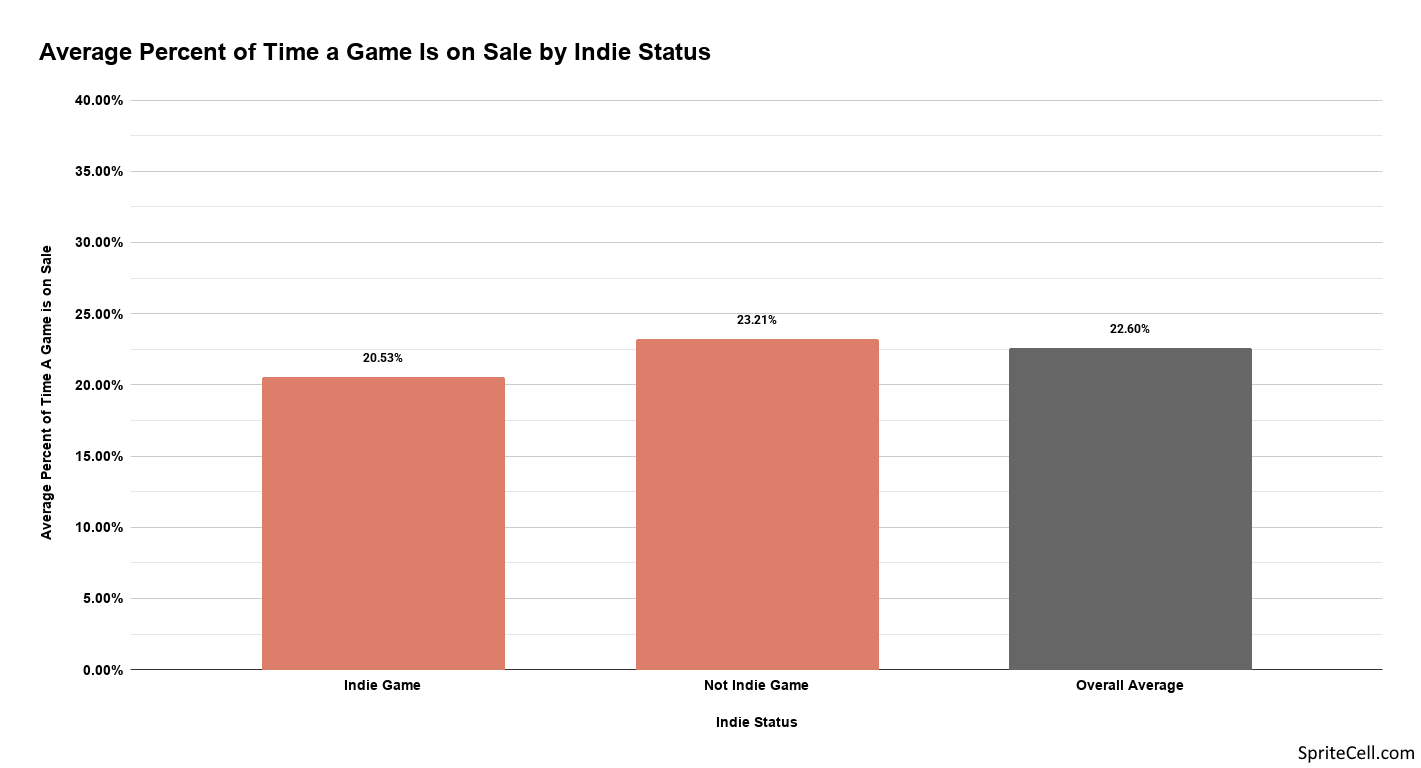
Indie games spend less time on sale, which surprises me a bit. You’d think they might be willing to do more, to out-sale the big guys to stand out more.

Indie games have lower base prices on average so it does make some sense that they would have smaller discounts.
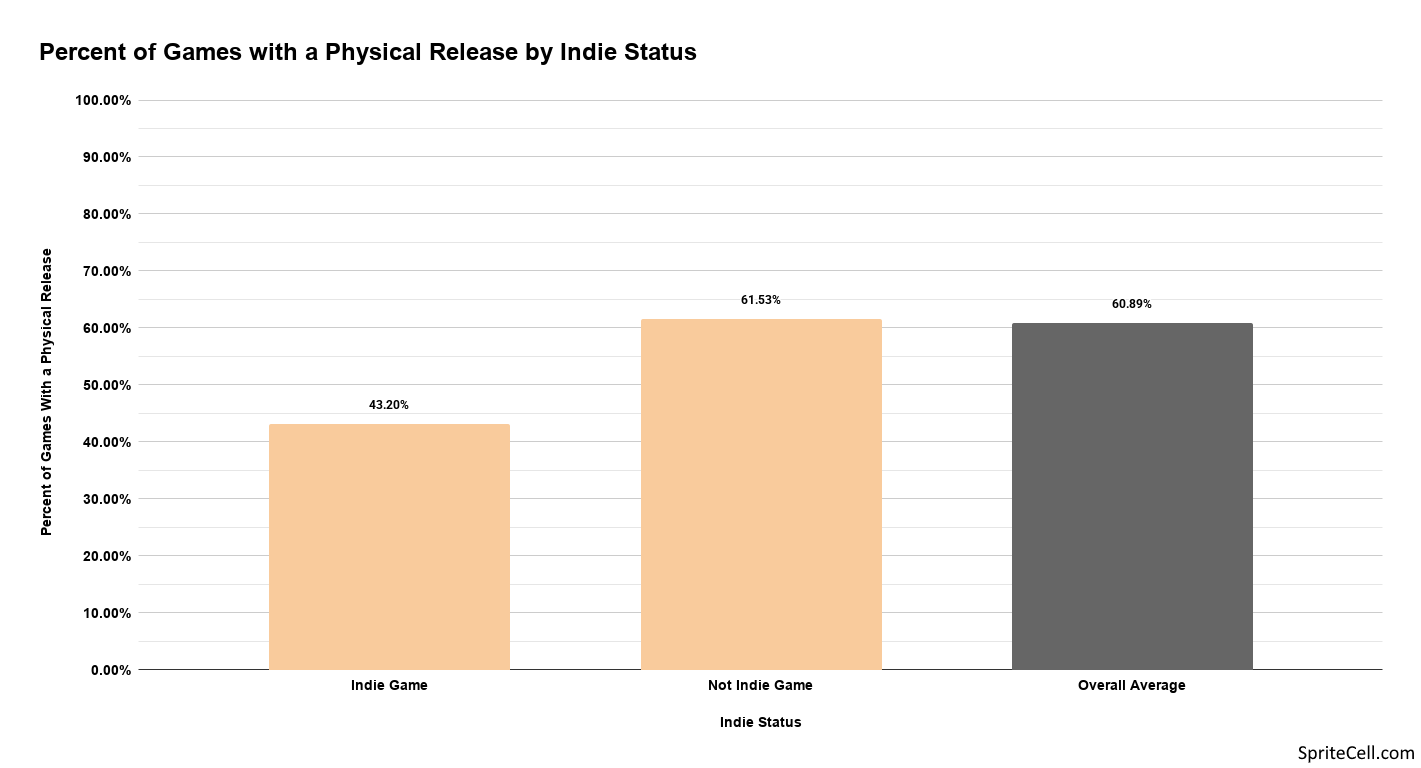
Annapurna has very few physical games, and as I’ve talked about before it makes less economic sense to make a physical version of a $30 game than a $60 one.

Those indie physical games that do get made are only made in small quantities and probably only one print run, leading to big prices as people discover them years later and want one.
On the digital side indies can’t discount as deeply, but base prices are about half of non-indies.
Miscellaneous Information About Game Prices

For this graph I did not include any sales that were ongoing as of January 1, 2023, or December 31, 2025, since they got cut off.
Thursday sees the beginning of about a fourth of all sales. Since sales tend to be close to two weeks long this means most sales end on a Wednesday, Thursday, or Friday.
People have more free time during the weekend, you’d think they’d be spending some of it checking out the new game sales, but there must be some market research that says it’s a bad time to start a sale. You might also think publishers would want to spread these sales out a bit more to avoid competing with each other.
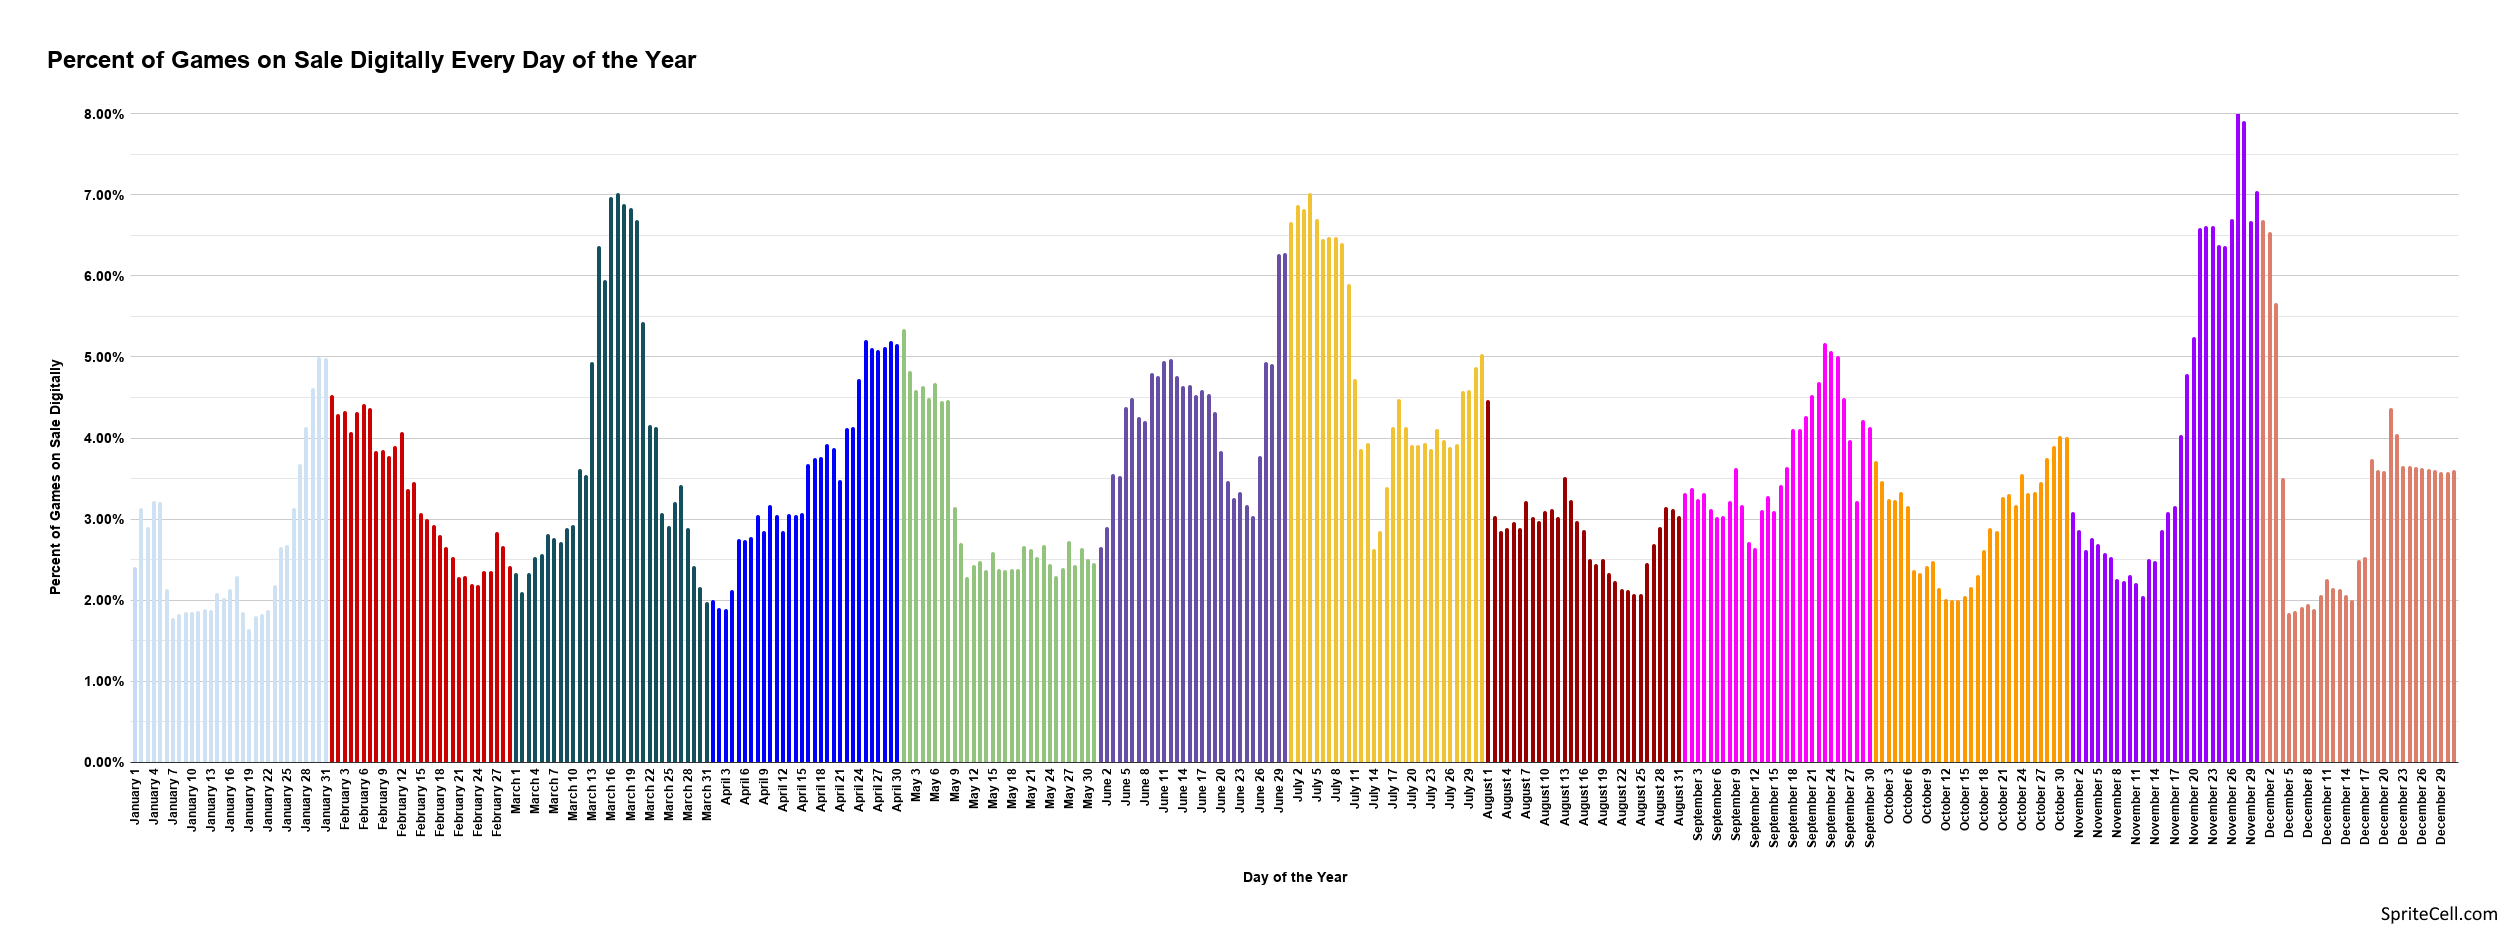
Here we have the percent of sampled games on sale every day of the year.
The biggest sale periods of the year are mid-March, late June and early July, and late November to early December, but there are several more distinct spikes. The late November to early December period is obviously Black Friday and Cyber Monday sales. Since so many publishers want to have sales during this time and sales are generally two weeks long (possibly due to storefront regulations) there is a subsequent crash in mid December, followed by more sales in late December lasting into early January targeting people with new game systems and gift cards.
Golden Week is a series of Japanese holidays in late April and early May and perhaps because of the large number of Japanese games included in this study there is a spike during that period. That assumes that publishers like to run sales in all territories at the same time, something I did not look into. The other big spikes I can’t really explain. I don’t associate the Fourth of July with video game sales, but searching around a bit I can see that digital storefronts as well as physical retailers very often have sales around this holiday.
The five days with greatest percent of games on sale: November 27 (8.20%), November 28 (7.91%), November 30 (7.04%), July 4 (7.02%), March 17 (7.02%)
The five days with smallest percent of games on sale: January 19 (1.64%), January 7 (1.78%), January 20 (1.80%), January 21 (1.83%), January 8 (1.83%)

This graph shows how digital sale prices changed from 2023 to 2024, from 2024 to 2025, and from 2023 to 2025. Discounts are generally expected to get larger over time, and we do see a decrease of up to $3 being the most common price change. Not far behind are games whose sales prices stayed exactly the same during each time period. Only about 11% of games saw average sale price increases from 2023 to 2025.
Most of the games sampled for this study are more than five years old and many have likely reached their sale price floor.
The game with the largest decrease in average sale price was Lego 2K Drive for PlayStation 4, a game released in mid 2023 and whose average sale price decreased by $34.
On the other hand, Horizon Zero Dawn Complete Edition for PC went from going on sale for around $12.49 to going on sale for $29.99, an increase of over $19.

Ending off with the most trivial graph, here are the number of cents you’re likely to see a sale price ending in. 99 dominates, with 49 a distant second. There’s quite a few number of cents that were never observed among 14,943 sales, but every amount ending with a 9 was seen at least once.
I didn’t make a graph for base prices because it would have been very boring. The only base prices not ending in 99 were all indie games and only their Switch releases for some reason: Among Us for Switch ($5.00), Hollow Knight for Switch ($15.00), West of Loathing for Switch ($11.00), and Baba is You for Switch ($15.00).
Sources
https://steamdb.info Price histories of games on Steam.
https://www.pricecharting.com/ Price histories of physical games, as observed by eBay sales.
https://psprices.com/region-us/index Price histories of console games.
https://isthereanydeal.com Price histories of non-Steam PC games.
Logos and system pictures: 1, 2, 3, 4, 5, 6, 7, 8, 9, 10, 11, 12, 13, 14, 15, 16, 17, 18, 19, 20

#/media/File:2K_2021_Logo.svg)
.svg)
.svg)