Table of Contents
Looking at the Game Awards
Every year in November when the Game Awards announces the year’s nominees people start speculating about which games will win. There’s quite a few common ideas about what kind of games win these awards: old legacy series, serious third person action games with strong narratives, the best sellers. To find out what kind of games actually win I gathered data on 14 metrics from all 11 Game Awards, and I’m going to use that data to try to predict 2025’s winners once the nominees are announced.
I must stress that I did not gather data for every award category at those Game Awards, and I will not be predicting every category. The non-game awards like Best Esports Athlete and Content Creator of the Year aren’t included, but there’s also another kind that I didn’t think would fit. Awards like Most Anticipated Game, Best Community Support, and Best Narrative are not asking voters “which of these nominees is the best game?”, they are asking “which of these games is the best at this one particular thing?”, unique metrics that I have no way of quantifying. I think it is important to only measure those awards that are all asking the same “which of these is the best?” question, like Best Indie Game, Best Fighting Game, or Game of the Year.
It’s worth going over how these nominees are selected and voted upon. Some person or group at the Game Awards chooses over 100 gaming outlets to make up the jury. These include gaming focused websites, YouTube channels, and newspapers such as IGN, The Guardian, Edge, NPR, Jeff Gerstmann, Easy Allies, and Entertainment Weekly. Each outlet submits five games for each award category. The five or six games with the most nomination nominations become the nominees. Those gaming outlets submit a vote for each category and their votes collectively have a 90% weight, while the public vote gets 10%. Geoff Keighley runs the whole thing but doesn’t choose the nominees and doesn’t have a vote.
For each metric I recorded whether the game with the highest or lowest score in a metric won and derived a score for every rank in every metric. I will sum these scores for every game included in the Game Awards 2025 to predict which will win in each category. I’ll explain this in further detail later, but here are the metrics I used to measure each game:
Metascore: Nominees at every Game Awards include many of the games with the highest metascores from Metacritic every year so this seemed like an obvious thing to look at. Both metascores and the Game Awards are (mostly, in the case of TGA) decided on by the gaming press, so there should be a lot of the same people involved. For games released on multiple platforms I went with the highest metascore, and only included platforms that the game had released on at the time of that year’s Game Awards.
Number of Reviews on Metacritic: The most popular games receive the most reviews and drive the most traffic and views. I think this is a decent way to measure “hype” or “popularity”. This is the sum total number of reviews for platforms that the game had released on at the time of that year’s Game Awards.
Number of Days of Eligibility: Games have to be released by a deadline in November to be eligible for that year’s Game Award. There’s no maximum age as some games, both part of and not part of the Best Ongoing Game category were eligible for previous year’s Game Awards and still receive nominations. I’ve seen some people claim that games released in the early part of the eligibility period, in late November through February, are forgotten about and are less likely to win, so I wanted to test that.
Number of Google Search Results: This is the number of search results that Google will return when searching for a game from January 1st of that year to the release deadline of that year. I occasionally removed some fussy formatting from titles that wasn’t consistently used to try to get the largest number possible. Some games with titles that mean something else, like “Doom”, “Monument Valley”, or “Control” were not counted. Another way to measure how “buzzy” or talked about a game is.
Number of Wikipedia Page Visits: Another way to measure how interested people are in a game. To record this I used a tool to measure how many visits a game’s Wikipedia page was visited from January 1st to that year’s deadline. For games that only have a subsection within another page, (like with Street Fighter V Champion Edition) I counted visits to the overall page (Street Fighter V). A few games did not have a Wikipedia page by the deadline and were not counted.
Number of Nominations: It seems likely that the games with the most nominations would be more likely to win. Though I am only working with a subset of award categories, for this metric any nomination that year counts.
Publisher: Some publishers routinely have their games nominated at the Game Awards. Their reputation varies, but I wanted to see if any publisher was consistently winning or losing.
Platform: I counted every system’s win percentage, including PC and Mobile, but I didn’t end up using this data for predictions in favor of the next metric.
Hardware Maker: Which hardware a game released on among PC, Mobile, Nintendo, PlayStation, and Xbox. A few games also released on Stadia or the Arcade, but they were not included. There’s always accusations of bias towards one company or platform so I wanted to see who really won most often.
Where It Was Made: I started with the three big regions of North America, Europe, and Japan, and then also recorded every other individual country which ended up including China, Brazil, South Korea, Australia, New Zealand, Russia, India, and South Africa. I have seen the Game Awards called American centric so I wanted to see if North American games really won more often.
Expansion, Remake, or Remaster?: If a popular game is released again is it judged more or less harshly? When a DLC is nominated is it brushed aside in favor of new games? This metric and the next four were recorded as a “yes” or “no” instead of a number.
Major Multiplayer Mode or Focus?: People like playing games with friends and people reviewing a game before release generally have fun playing with each other. But does that multiplayer stickiness translate to winning awards? This was one of the hardest metrics to measure, with many games having a simple and rarely played multiplayer mode, requiring me to research how important multiplayer was to many games. Pretty much every fighting or sports game counted as multiplayer focused. The Best Multiplayer Game category was not included.
Based on a Non-Gaming IP?: Games based on other properties, such as an anime, Game of Thrones, or Marvel can be seen as cheaply made cash-ins, but does it effect the likelihood they’ll win an award? Sports games got a “no” for this metric.
Sequel or Part of a Series?: Sequels are often improvements over the original and voters may be more likely to enjoy familiar games.
Part of a 15+ Year Old Series?: Like the previous metric, but for series that have been around a long time and are probably familiar to everyone. Some say these old “legacy” series have an advantage.
I would have loved to have been able to compare sales numbers of each nominee, but many games don’t release sales figures or do so only at set intervals so there just wasn’t a way to compare them.
Almost all of the 154 award categories included in this study had 5 nominees, but 3 had 4 nominees, and 16 had 6 nominees, which became a real pain when figuring out the math. What this means for the typical five nominee awards is that if, for example, the game with the highest metascore among the nominees wins one in five times (20%) on average then it is not a contributing factor to winning or losing, it’s as predictive as random chance. Keep that 20% figure in mind with the following graphs.
Metric Stats and What Games Win
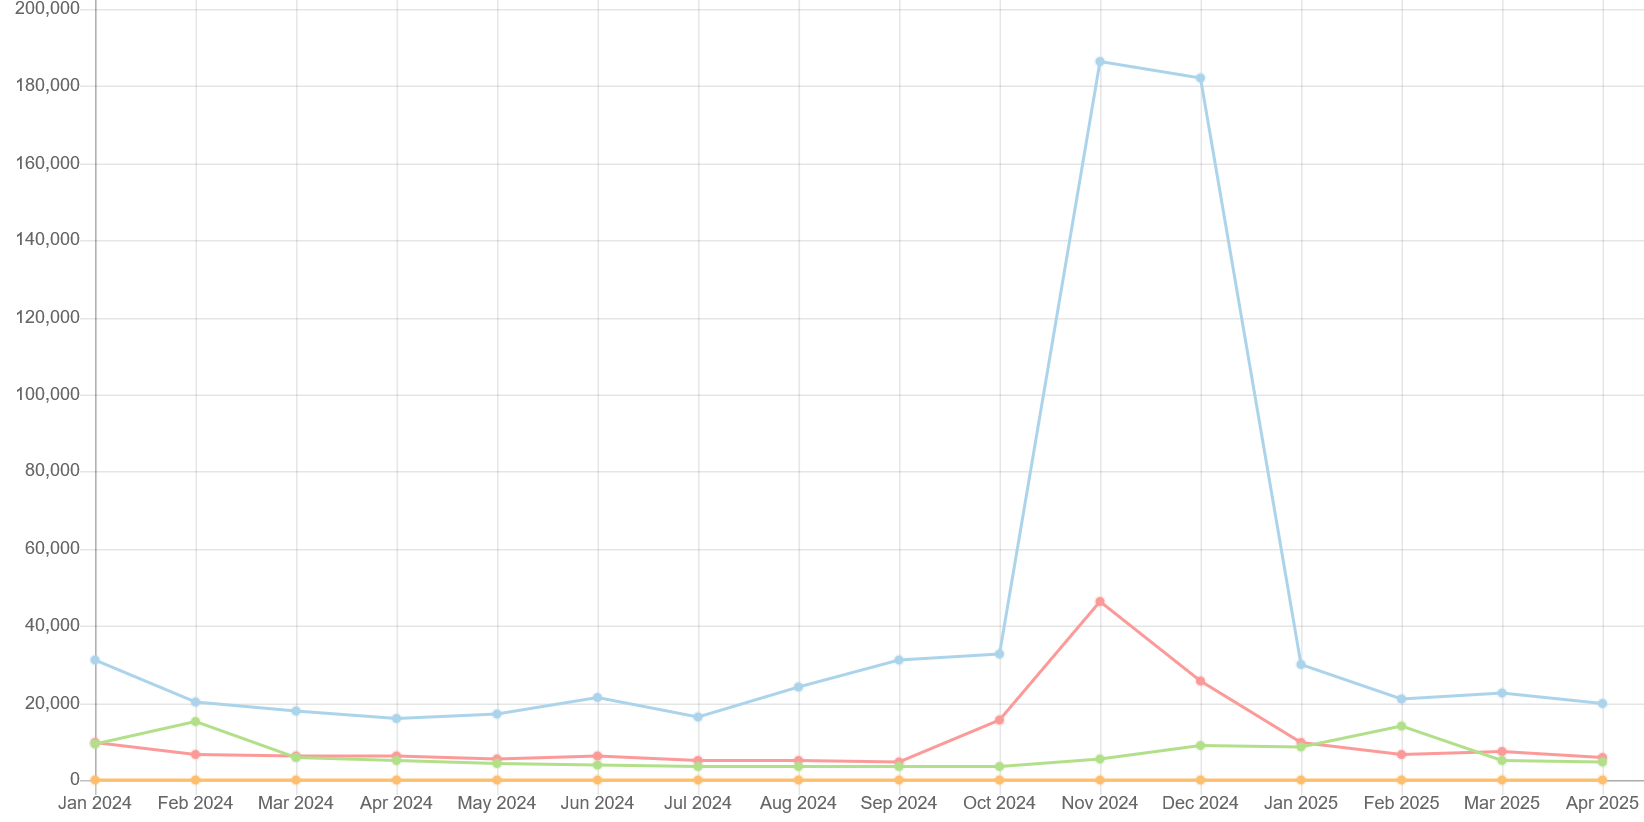
Metascore
Games nominated for Game Awards have very high metascores, with an 85 average. That 59 low belongs to One-Punch Man: A Hero Nobody Knows while the 97 high is shared by The Legend of Zelda: Breath of the Wild, Super Mario Odyssey, and Red Dead Redemption 2. The lowest scored game to win an award among the included categories was Pokémon Go with 69.
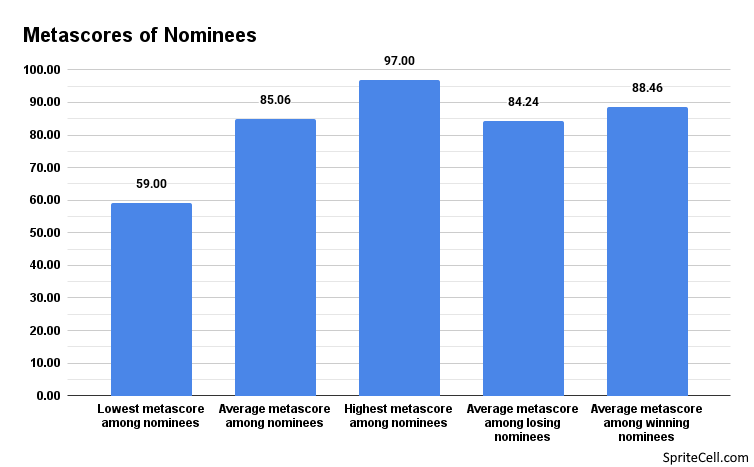
Winners are definitely more likely to have higher metascores, in fact having the highest metascore among a set of nominees ended up being the second most impactful factor in predicting a winner, while very few games with the lowest end up winning.
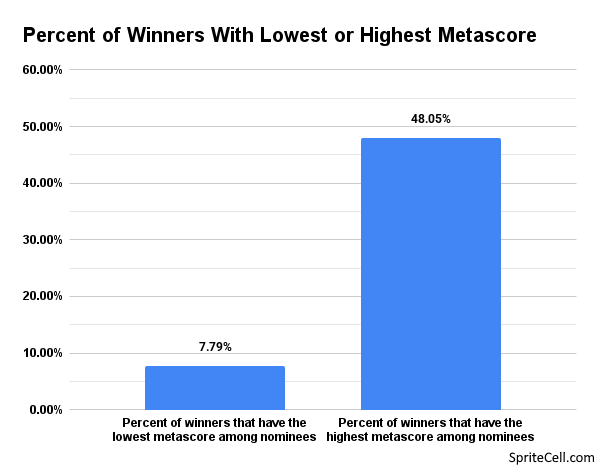
Number of Reviews on Metacritic
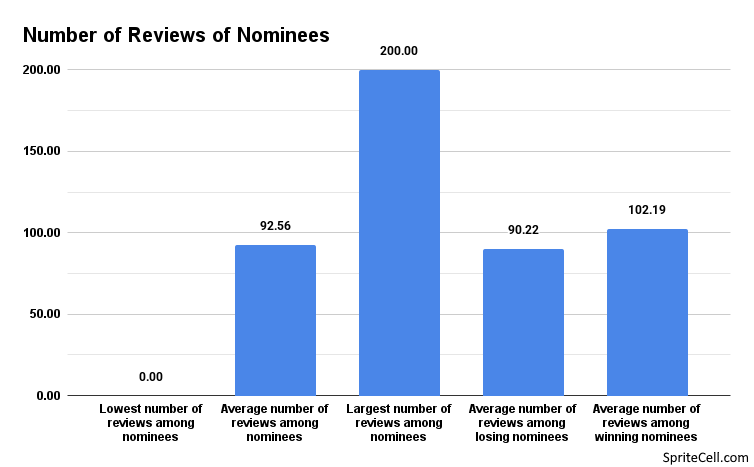
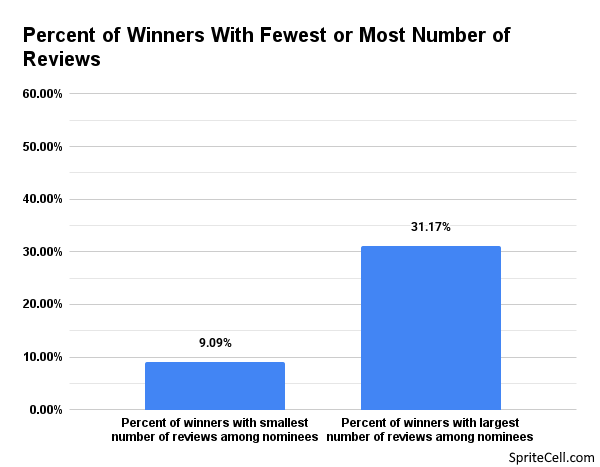
A large Number of Reviews on Metacritic does have some correlation with games that win their category, but a not a huge one. A few of the included games have no reviews on Metacritic because they are early access and few reviewers will review such games before their official release.
Doom Eternal released on quite a few platforms, helping it reach 200 reviews. A few other games with a large number of reviews were FIFA 16 (189), Destiny 2 (164), Resident Evil Village (167), God of War Ragnarök (194), Resident Evil 4 (187), Cyberpunk 2077 (173), and Star Wars Outlaws (166).
Number of Days of Eligibility
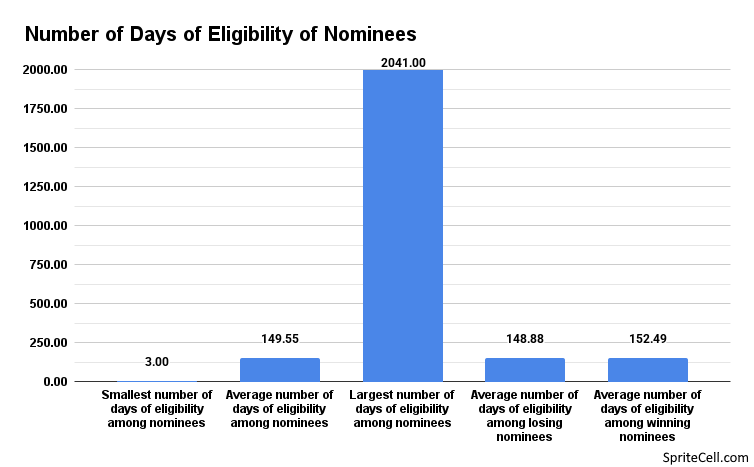
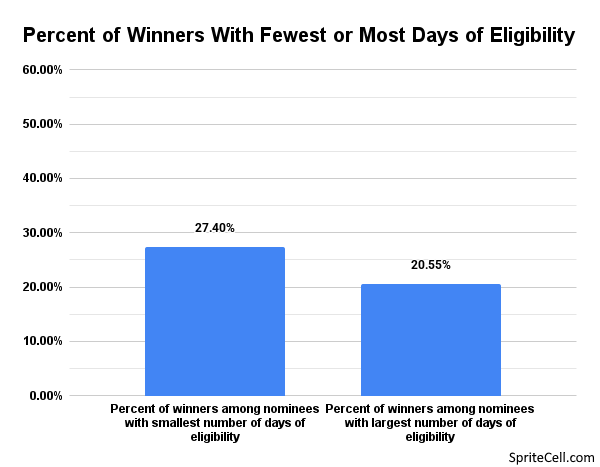
The most recently released game among a set of nominees is just a bit more likely to win than the other nominees. However, uniquely among these metrics the opposite, the oldest games, are also very slightly more likely to win than random chance.
This metric was a bit skewed by a handful of games that were nominated long after their release. There’s a Best Ongoing Game category (which has plenty of games less than a year old) but it was excluded from this metric. Apparently games more than a year old are eligible for any category anyway because, for example, Final Fantasy XIV was nominated for Best RPG in 2019, when it was 2,041 days old. It was also nominated for Best Ongoing Game in 2019, 2021, 2022, and 2023, but in 2024 it was instead Final Fantasy XIV: Dawntrail that was nominated.
Super Smash Bros. for Nintendo 3DS and Mortal Kombat 11: Ultimate Edition both released three days before the deadline.
Number of Google Search Results
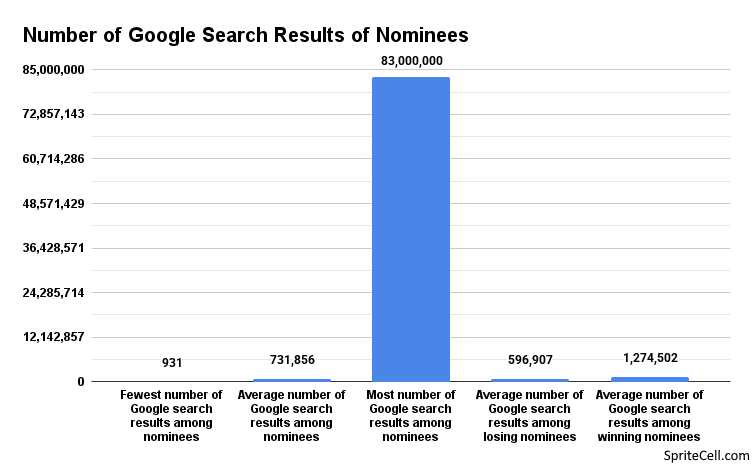
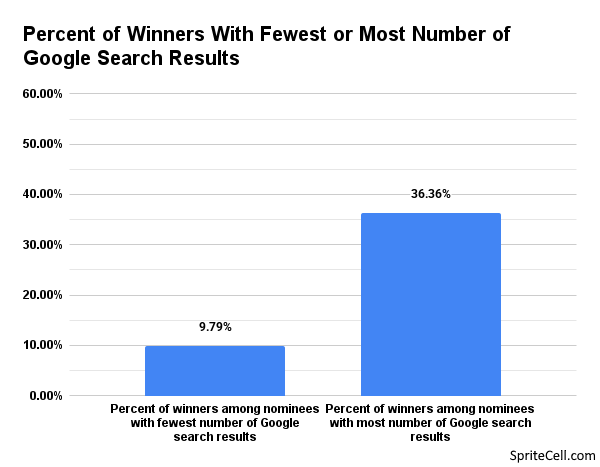
There is a modest relationship between the number of Google search results for a game and how likely it is to win, not huge though. Guides, forum threads, articles are all plentiful about the most popular games.
The fewest search results goes to 2015’s free to play fighting game Rising Thunder, which was closed not long after release. That also happens to be one the rare four nominee categories.
The only games to to reach over 10,000,000 results were Genshin Impact, Among Us, Elden Ring, Honkai: Star Rail, Zenless Zone Zero, and Fortnite. Fortnite absolutely towers over them, with 60 million results in 2023 and adding 20 million more in 2024.
Number of Wikipedia Page Visits
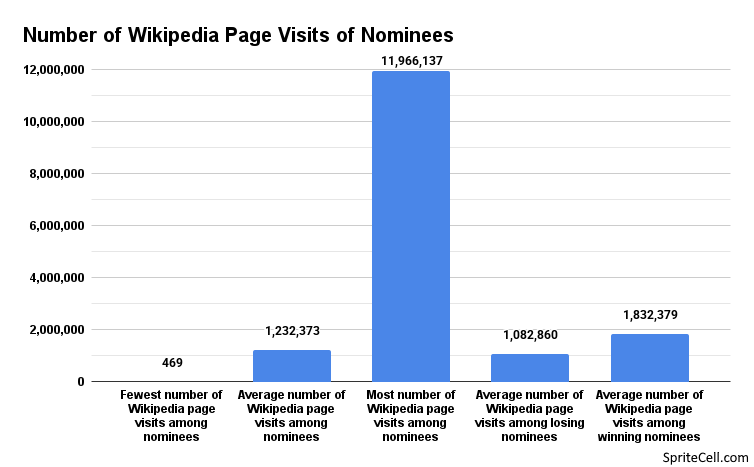
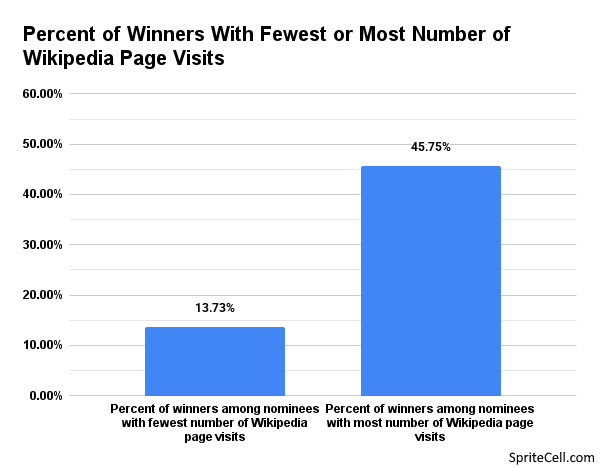
I wasn’t sure if this metric would amount to anything, but having the most Wikipedia page visits is actually quite good at predicting a winner. People like to read up on the best games.
While several games weren’t counted because their pages hadn’t been created yet, Hello Kitty Island Adventure’s page was new enough to come in at a low of 469 visits.
A few games managed over 10,000,000 views: The Witcher 3: Wild Hunt, Until Dawn, Pokémon Go, and claiming the most views was Fallout 4.
Number of Nominations
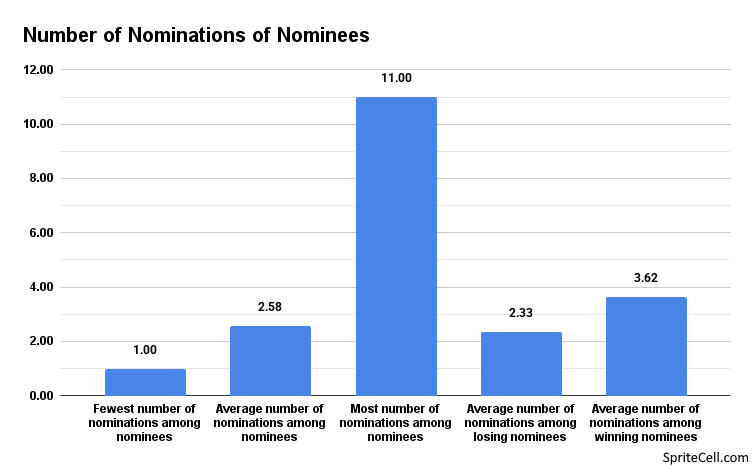
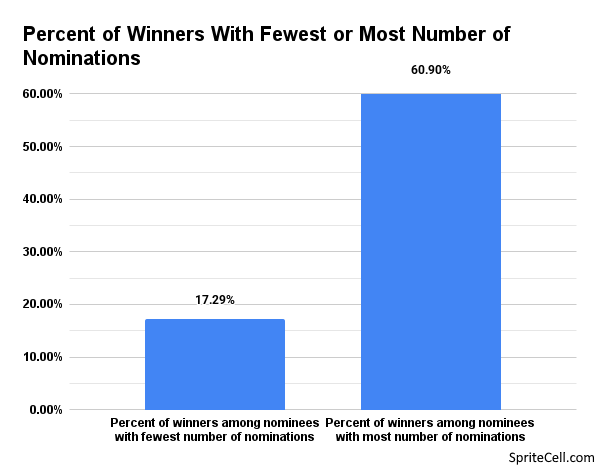
Having more Game Award nominations than the other nominees is the single best indicator that a game will win. It makes some sense, any game nominated for Game of the Year usually wins its Best [Genre] Game category. Having the fewest nominations only makes a game a bit unlikely to win.
In the first few years of the Game Awards there were both fewer total categories and nominations were more spread out, but now there’s always a few games with more than six nominations.
Death Stranding received 10 nominations while both The Last of Us Part II and God of War Ragnarök received 11.
Publisher
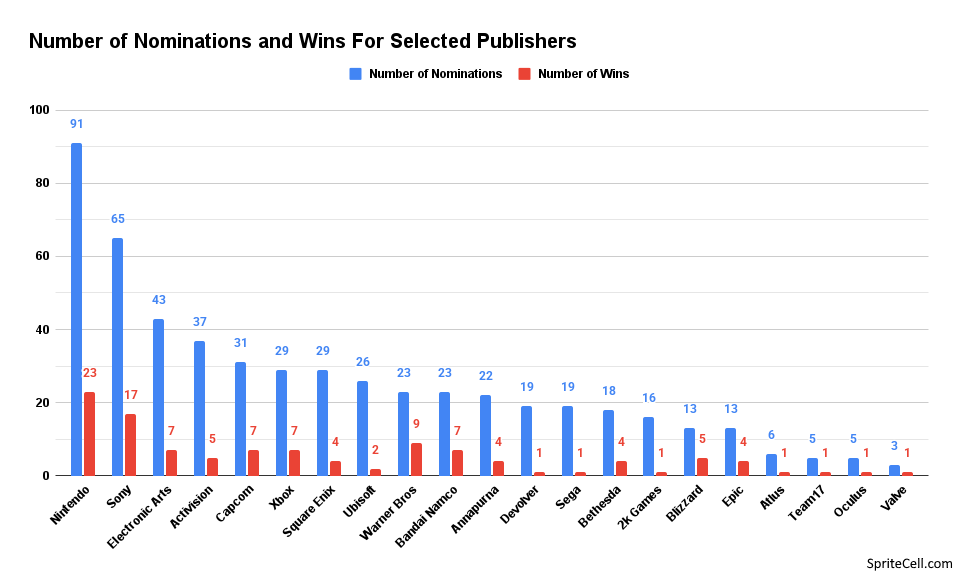
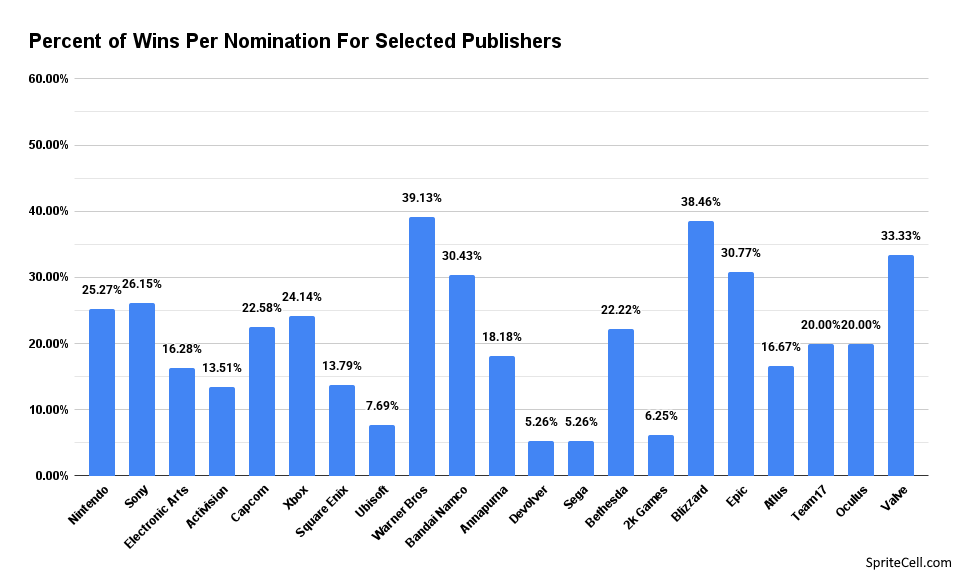
These graphs don’t include every publisher, only those that have received a lot of nominations over the years, sell gaming hardware, or run a digital game store. There’s quite a few developers who only publish their own games, and only release a game every once in a while but the data isn’t meaningful without a large enough sample size. I decided to cut every publisher with fewer than 2k Games’ 16 nominations for predictions
Please note that this data only includes the categories that I am recording data for, most of these publishers have games that have been nominated for other awards.
Warner Bros. Games has won the greatest share of its nominations, with Blizzard close behind. Nintendo, Sony, and Xbox published games are only slightly more likely to win.
2k publishes a lot of sports games, but their only win has been for Civilization VI among the categories being studied.
Platform
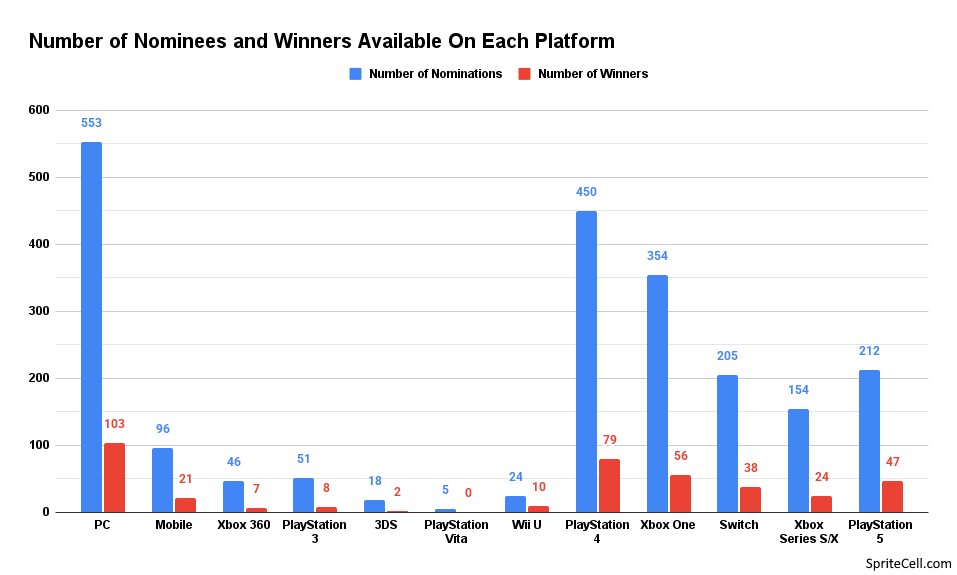
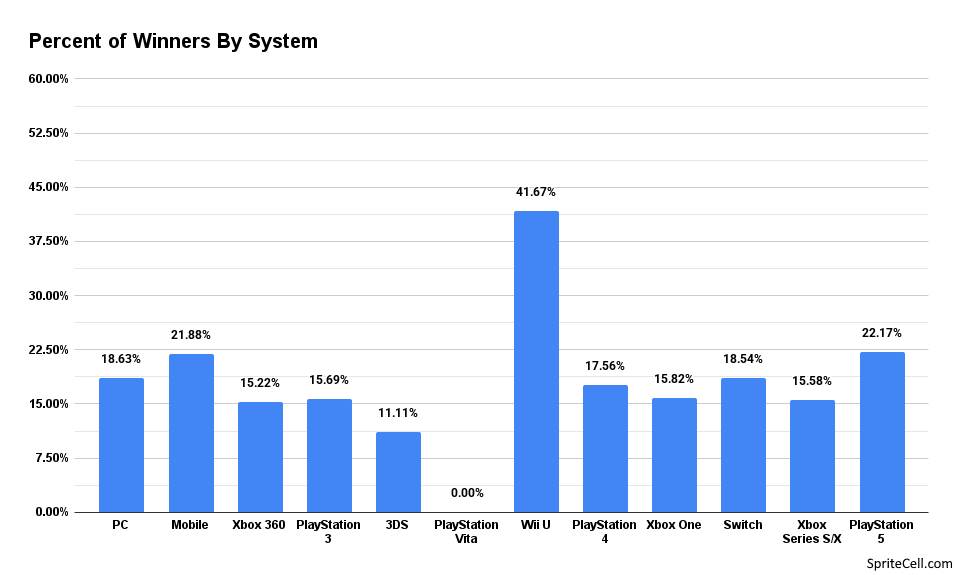
We don’t need to linger too long on these since they aren’t being used for predictions, but Wii U games sure cleaned up. This is largely due to The Legend of Zelda: Breath of the Wild and Mario Kart 8.
Hardware Maker
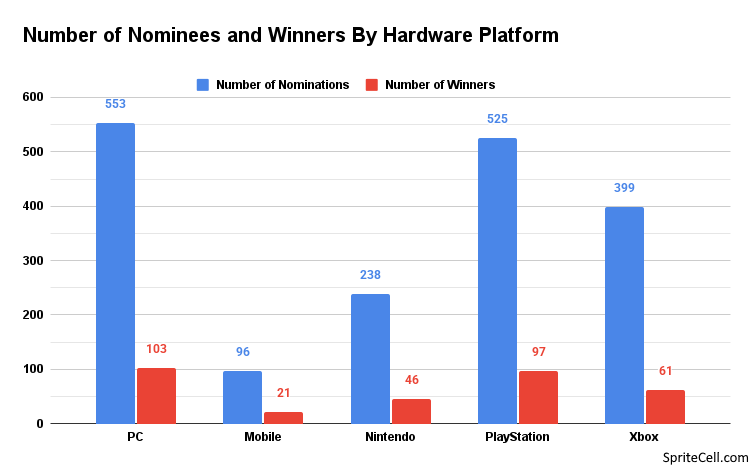
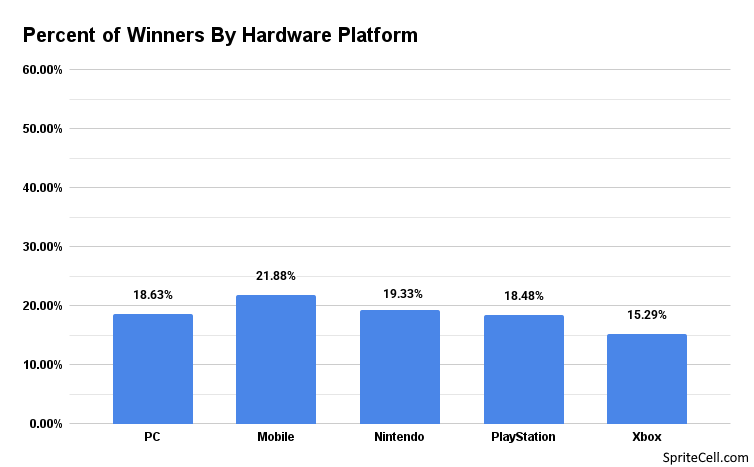
PC and PlayStation games have a solid lead on most games up for nomination but everyone is pretty close in terms of win percentage. Mobile games have their own category, and aren’t common outside of it. Xbox ends up being the biggest outlier.
If you’re wondering how everything but Mobile can be below the baseline 20% figure, it’s because most games release on multiple platforms. On average a game releases on 2.3 of these five.
Where It Was Made
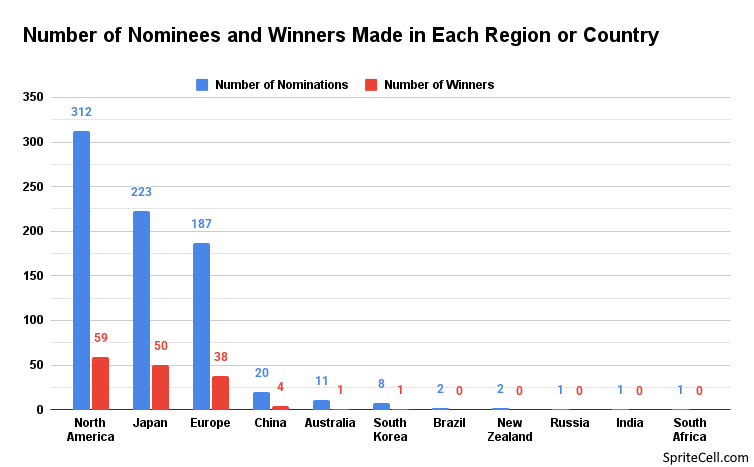
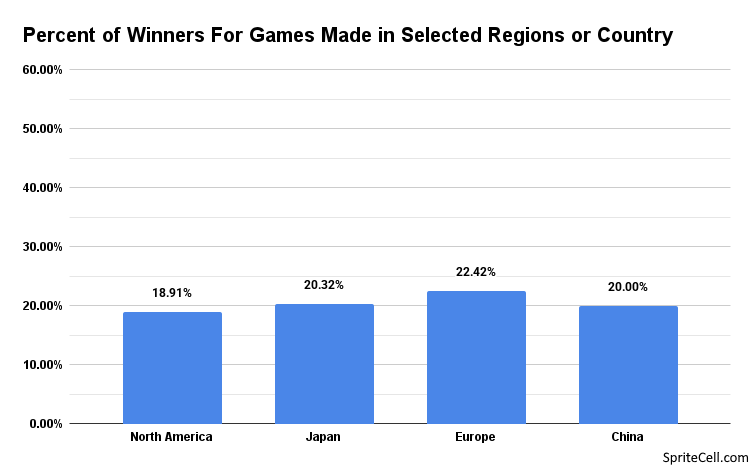
While it’s true that North America gets the most nominations, its win rate is lower than Japan’s or Europe’s.
I’m not including anything with fewer nominations than China for predictions, not a large enough sample.
Overall, where a game was made has even less of an impact than what systems it was released on.
The Five Yes/No Questions
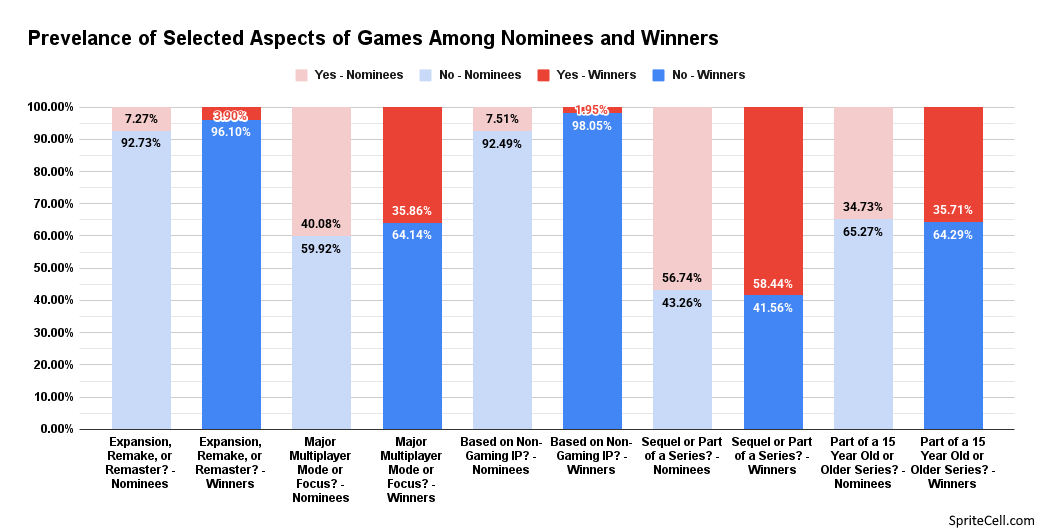
The pale colors are for nominees and the saturated colors are for winners. Yes is always on top.
These overall don’t have much of an impact on a nominee’s chances of winning. Being based on a non-gaming IP is the largest difference maker, and it’s a negative.
Aside from the predictive ability of these stats I was surprised there were so few remakes and remasters being nominated, and it’s nice to put numbers to how many of the most popular games have a multiplayer focus, or are part of a long-running series.
Turning the Data Into Predictions
At first I thought I would simply subtract the percent of winners with the highest and lowest value from 20% and use that as a “score”. But as I thought about it more I realized that linear distance isn’t what I should be measuring. A one in five chance is the baseline, and if the lowest value has a one in six chance (16.67%) of winning and has a -x score, then a highest value with a one in four (25%) chance should be symmetrical and be worth +x. But if you just subtract 16.67 and 25 from 20, you get different absolute values.
So I settled on a 20% giving 0 and every “one in x” chance is worth -1 or +1. So, for example, winners have the highest Metascore 48.05% of the time. This is a one in 2.08 chance. Subtract the baseline chance of five and you get 2.92, that’s the “score” added to a game with the highest Metascore in a category. Do the same for the chance of winning with the lowest score and you get -7.83. Now, I could have maybe figured out a non-linear relationship between chance of winning and chance of losing but I didn’t think I could figure that out, so there’s equal steps of 2.69 between each rank of Metascore.
For the Yes/No questions I have just subtracted the winning value from the losing. These all ended up being quite small.
Then I did everything again for categories with six nominees. I’m hoping four nominee categories don’t make a comeback so I don’t have to figure them out too.
What I’ll do when the 2025 nominees are announced is gather all of the data in all of the selected metrics and sum the scores for each game, and then whichever game has the highest score is the predicted winner. I’ll post these scores in the section below and we’ll see how accurate they turn out to be when the winners are revealed in December. I’ll be posting about how I did on Bluesky too.
Here’s the predictive scores for every rank of every metric, ordered highest to lowest. I worry some of the publisher values are too negative, they do all win sometimes and the sample size isn’t large. Overall I was pleasantly surprised that there was so little bias towards any platform or where a game was made, games with the most interest and the best review scores win the most often.
| Number of Nominations – 1st | 3.36 |
| Metascore – 1st | 2.92 |
| Wikipedia Page Visits – 1st | 2.81 |
| Published by Warner Bros | 2.44 |
| Number of Nominations – 2nd | 2.32 |
| Google Search Results – 1st | 2.25 |
| Number of Reviews – 1st | 1.79 |
| Published by Bandai Namco | 1.71 |
| Wikipedia Page Visits – 2nd | 1.54 |
| Days of Eligibility – 5th | 1.35 |
| Number of Nominations – 3rd | 1.29 |
| Published by Sony | 1.18 |
| Based on Non-Gaming IP? – No |
1.09 |
| Days of Eligibility – 4th | 1.05 |
| Published by Nintendo | 1.04 |
| Major Multiplayer Mode or Focus? – No |
0.87 |
| Published by Xbox | 0.86 |
| Days of Eligibility – 3rd | 0.74 |
| Expansion, Remake, or Remaster? – No |
0.72 |
| Published by Capcom | 0.57 |
| Made in Europe | 0.54 |
| Published by Bethesda | 0.50 |
| Sequel or Part of a Series? – Yes |
0.46 |
| Days of Eligibility – 2nd | 0.44 |
| Released on Mobile | 0.43 |
| Google Search Results – 2nd | 0.38 |
| Wikipedia Page Visits – 3rd | 0.27 |
| Part of a 15 Year Old or Older Series? – Yes |
0.26 |
| Number of Nominations – 4th | 0.25 |
| Metascore – 2nd | 0.23 |
| Days of Eligibility – 1st | 0.13 |
| Made in Japan | 0.08 |
| Made in China | 0.00 |
| Number of Reviews – 2nd | -0.16 |
| Released on a Nintendo System | -0.17 |
| Part of a 15 Year Old or Older Series? – No |
-0.26 |
| Made in North America | -0.29 |
| Released on PC | -0.37 |
| Released on a PlayStation System | -0.41 |
| Sequel or Part of a Series? – No |
-0.46 |
| Published by Annapurna | -0.50 |
| Expansion, Remake, or Remaster? – Yes |
-0.72 |
| Number of Nominations – 5th | -0.78 |
| Major Multiplayer Mode or Focus? – Yes |
-0.87 |
| Wikipedia Page Visits – 4th | -1.01 |
| Based on Non-Gaming IP? – Yes |
-1.09 |
| Published by Electronic Arts | -1.14 |
| Google Search Results – 3rd | -1.48 |
| Released on an Xbox System | -1.54 |
| Number of Reviews – 3rd | -2.10 |
| Published by Square Enix | -2.25 |
| Wikipedia Page Visits – 5th | -2.28 |
| Published by Activision | -2.40 |
| Metascore – 3rd | -2.46 |
| Google Search Results – 4th | -3.35 |
| Number of Reviews – 4th | -4.05 |
| Metascore – 4th | -5.15 |
| Google Search Results – 5th | -5.21 |
| Number of Reviews – 5th | -6.00 |
| Metascore – 5th | -7.84 |
| Published by Ubisoft | -8.00 |
| Published by 2k Games | -11.00 |
| Published by Devolver | -14.01 |
| Published by Sega | -14.01 |
The Game Awards 2025 Predictions
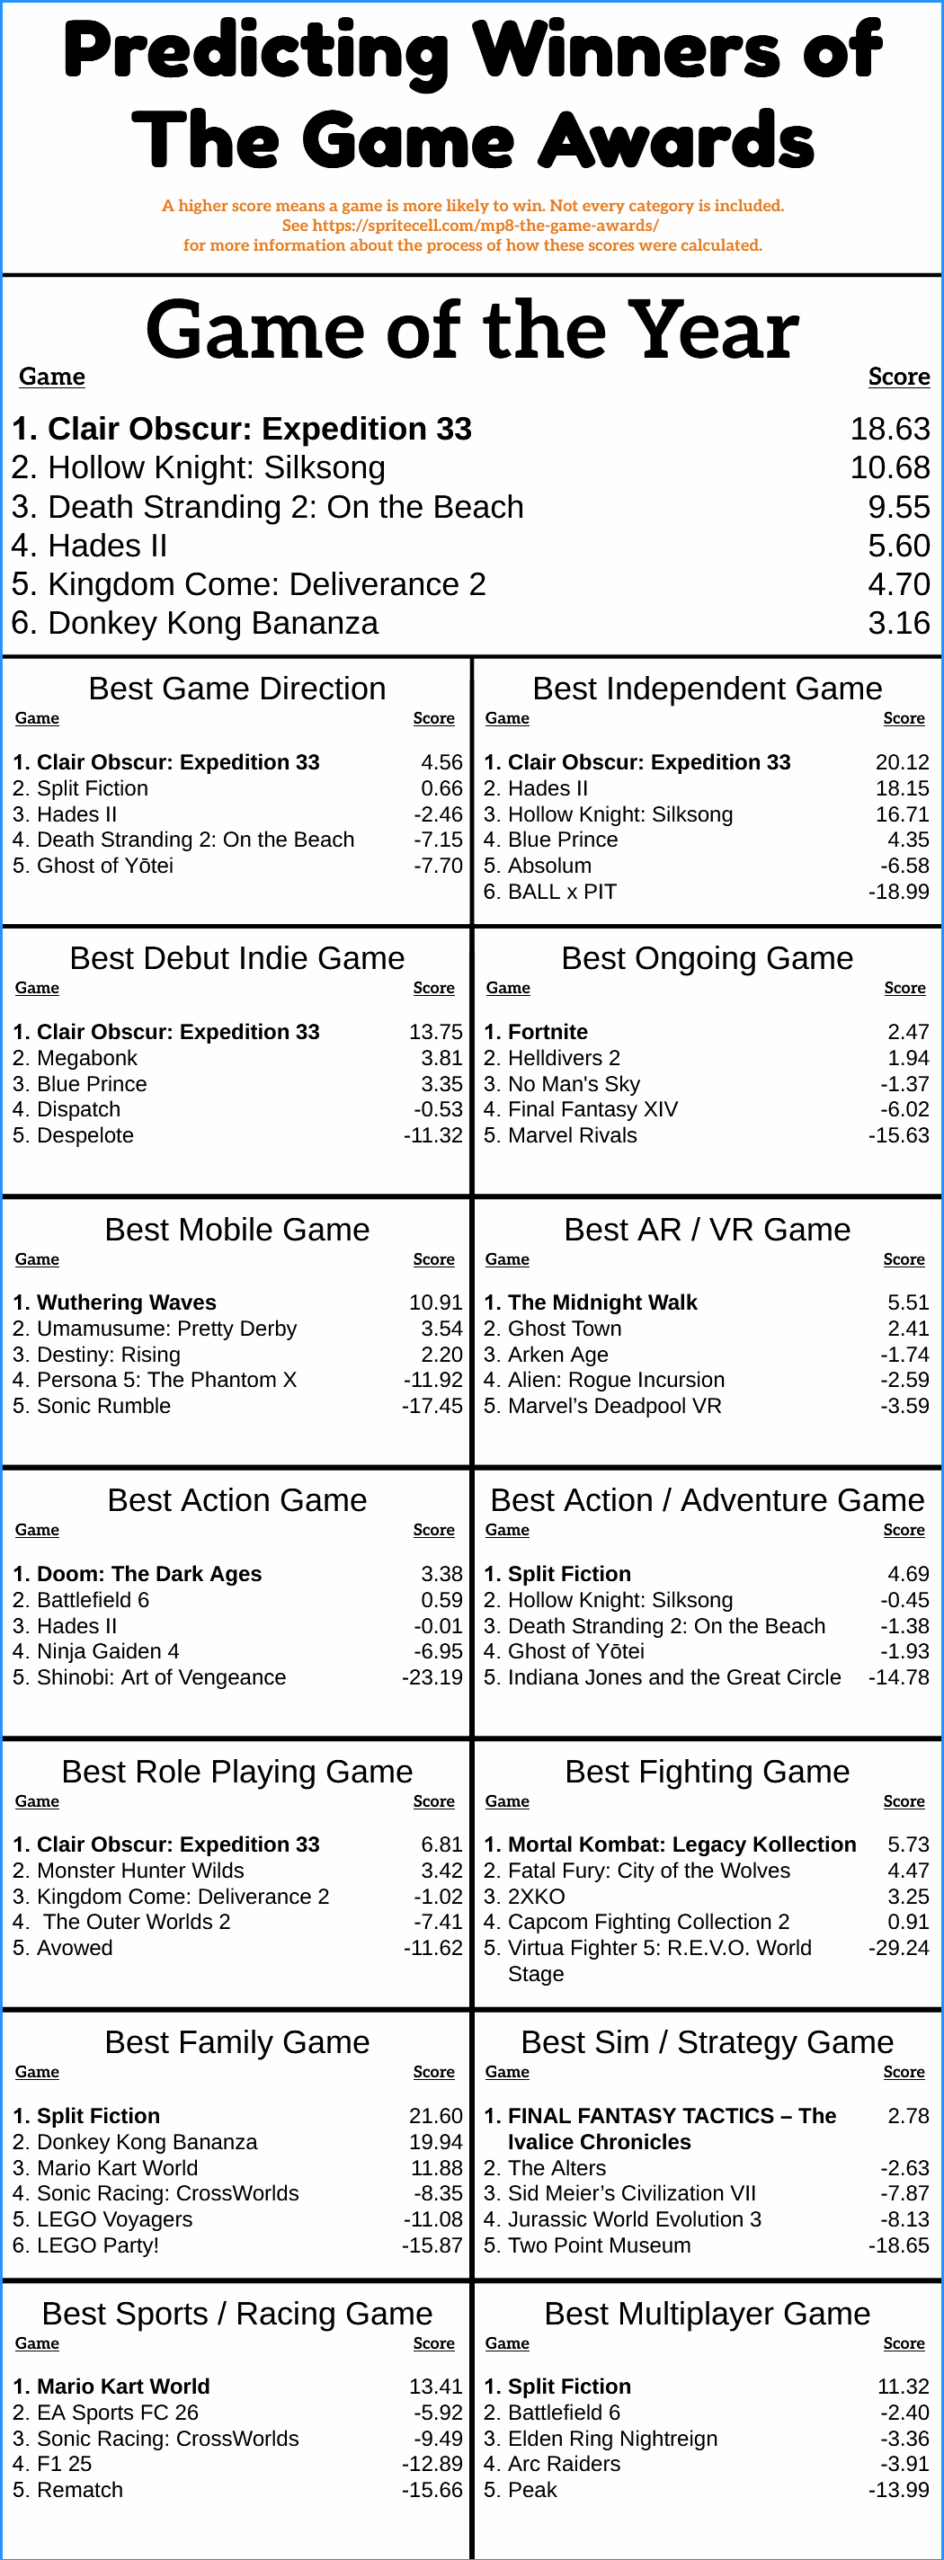
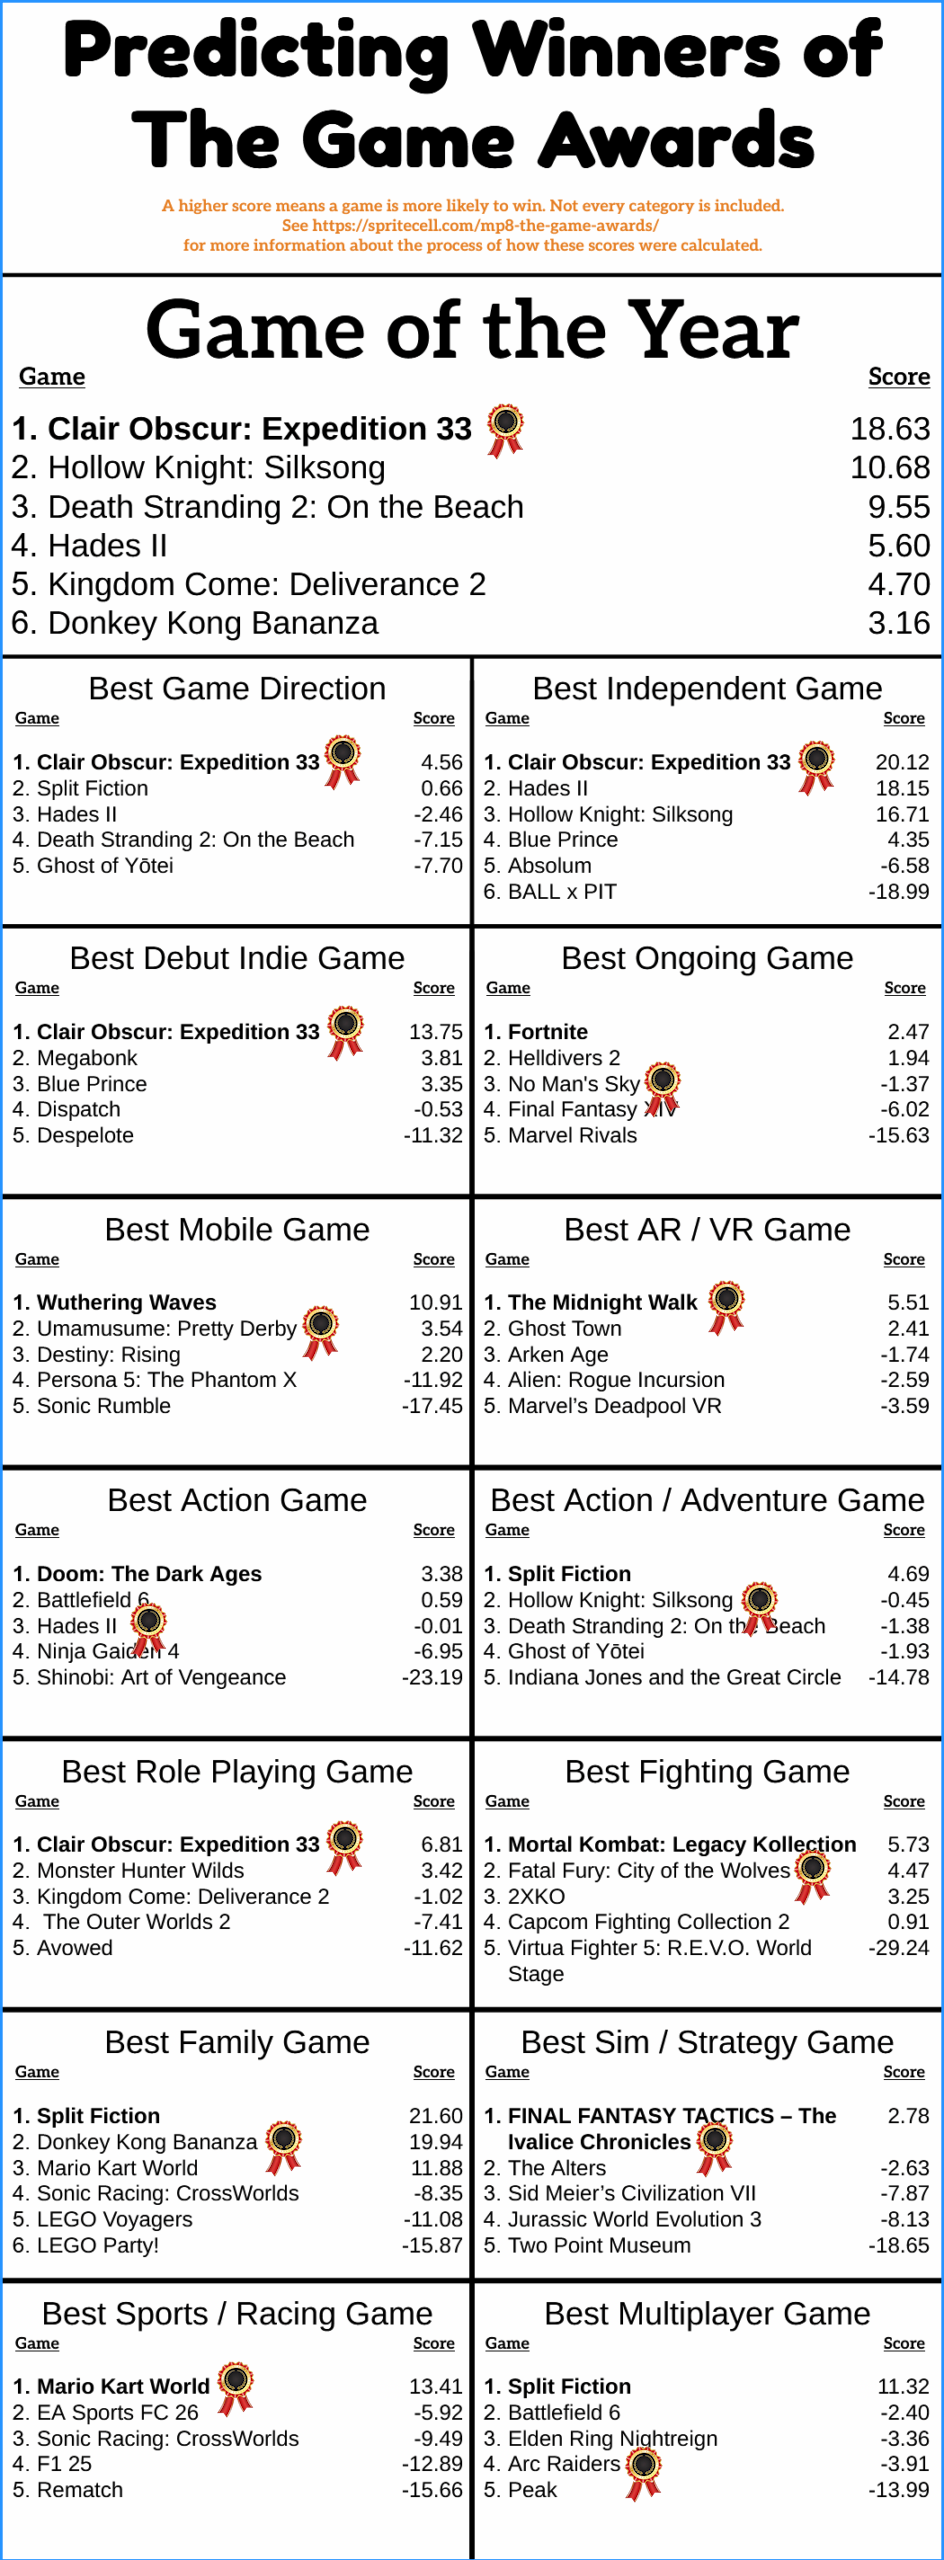
Here it is, my predictions based on all the stats I gathered. Clair Obscur looks to be set to win all five of the awards I’m looking at this year.
Fortnite over Helldivers 2 for ongoing game seems a bit unlikely to me, but I am not putting my thumb on the scale at all. Wuthering Waves also doesn’t seem like it would win over Umamusume: Pretty Derby to me.
We have a few close races in Indie, Ongoing, Fighting, and Family.
How many correct answers do I need for these to be considered “successful” predictions? Let’s say I get three points for identifying the winner and one point when the second highest score wins. The maximum would be 45 points, but I’d say I’d be pretty happy with 25 points.
Update: The developer of Megabonk has stated that his game should not qualify for Best Debut Indie and has requested that it be removed from contention, which Geoff Keighley has agreed to. I really don’t want to remake the graphic, but Blue Prince now has the second highest score.
The Results
 So, how did I do? By the metric I outlined above I got 28 points, but this isn’t exactly a rousing success. Clair Obscur swept the awards, as was predicted, but the predictions weren’t great outside of that. Of the 15 awards predicted 8 were correct, 4 of the second places won, 2 of the third places won, and a single fourth place won.
Split Fiction was favored to win three awards, thanks to having the highest metascore, most reviews on metacritic, and most google search results for every category, as well as a large number of nominations, yet it didn’t win any. I’m a bit surprised, as It Takes Two won game of the year and many other awards in 2021, and Split Fiction is a very similar game.
I expected Umamusume to win best mobile game, I hear about it quite a bit more than Wuthering Waves. The biggest upset according to this prediction model was Arc Raiders, a game with poor showings in all of the predictive scores. I would have expected the AI voice controversy to have caused enough members of the jury to not vote for it, though it was undoubtedly the “buzziest” multiplayer game during the voting period.
I could think up a few more categories to measure, but I don’t plan on doing this year. The model did alright, but wasn’t really better than a lot of people who predicted winners.
Sources and Further Reading
https://en.wikipedia.org/wiki/The_Game_Awards
https://thegameawards.com/voting-jury
https://www.polygon.com/awards/450688/what-makes-game-of-the-year-tgas
Sam says:
Can’t you make predictions now with this info and then refine it later?
The locks for best game are
1. E33
2. Hollow knight
3. Hades 2
4. Donkey kong
5. Death stranding 2
6.?????
It’s really only the sixth spot that could be split fiction, kingdom come, or maybe ghost of yotei.
SpriteCell says:
While we can likely guess the the future nominees for Game of the Year the way I have approached this requires me to know exactly who the nominees are so that I can rank them according to various metrics. There are more awards than Game of the Year, too. I don’t have time or the will to make many predictions based on various possibilities.
SAM says:
What do you predict since the nominations are out?